Choosing a method
Pick an analysis in Vesta Online: the six goals on the Analysis step, the methods each one lists, and what it means when a method is unavailable.
Every analysis in Vesta Online starts on the Analysis step of Analyze, where you pick one method. You can narrow the list by what you want to find out, or search it by name. This article walks that step on a copy of the Diabetes and poverty sample and lists the methods under each goal. Nothing is run here; each method has its own article. The screenshots come from the walk.
The steps
Section titled “The steps”- Open a projectOpen the Projects page, select a project and choose Open Project. This walk-through uses a copy of the Diabetes and poverty sample, so the sample itself is not touched. Which methods you can run depends on the data in the open project.
- Open AnalyzeChoose Analyze in the left rail. The Analysis step opens as step 1 of 1, because the method you pick decides the steps that follow; until then the rail reads Steps appear once you pick a method. A line under the heading counts the methods this project can run: for this project, 13 of 28.
- Pick a goalUnder What do you want to find out? choose one of six goal cards. The Suggested methods list on the right narrows to the methods for that goal, and the ones this project can run carry a Recommended badge. Choosing the same card again clears it. Every method stays reachable from Search, so a goal narrows the list and never locks it.
- Search all analysesType in the Search all analyses box to find a method by name. Searching krig lists Kriging alone. A method this project cannot run stays in the list, grayed, with a sentence that says why; choose a method that is not grayed, then Pick a method.
What you should see
Section titled “What you should see”The Analysis step
Section titled “The Analysis step”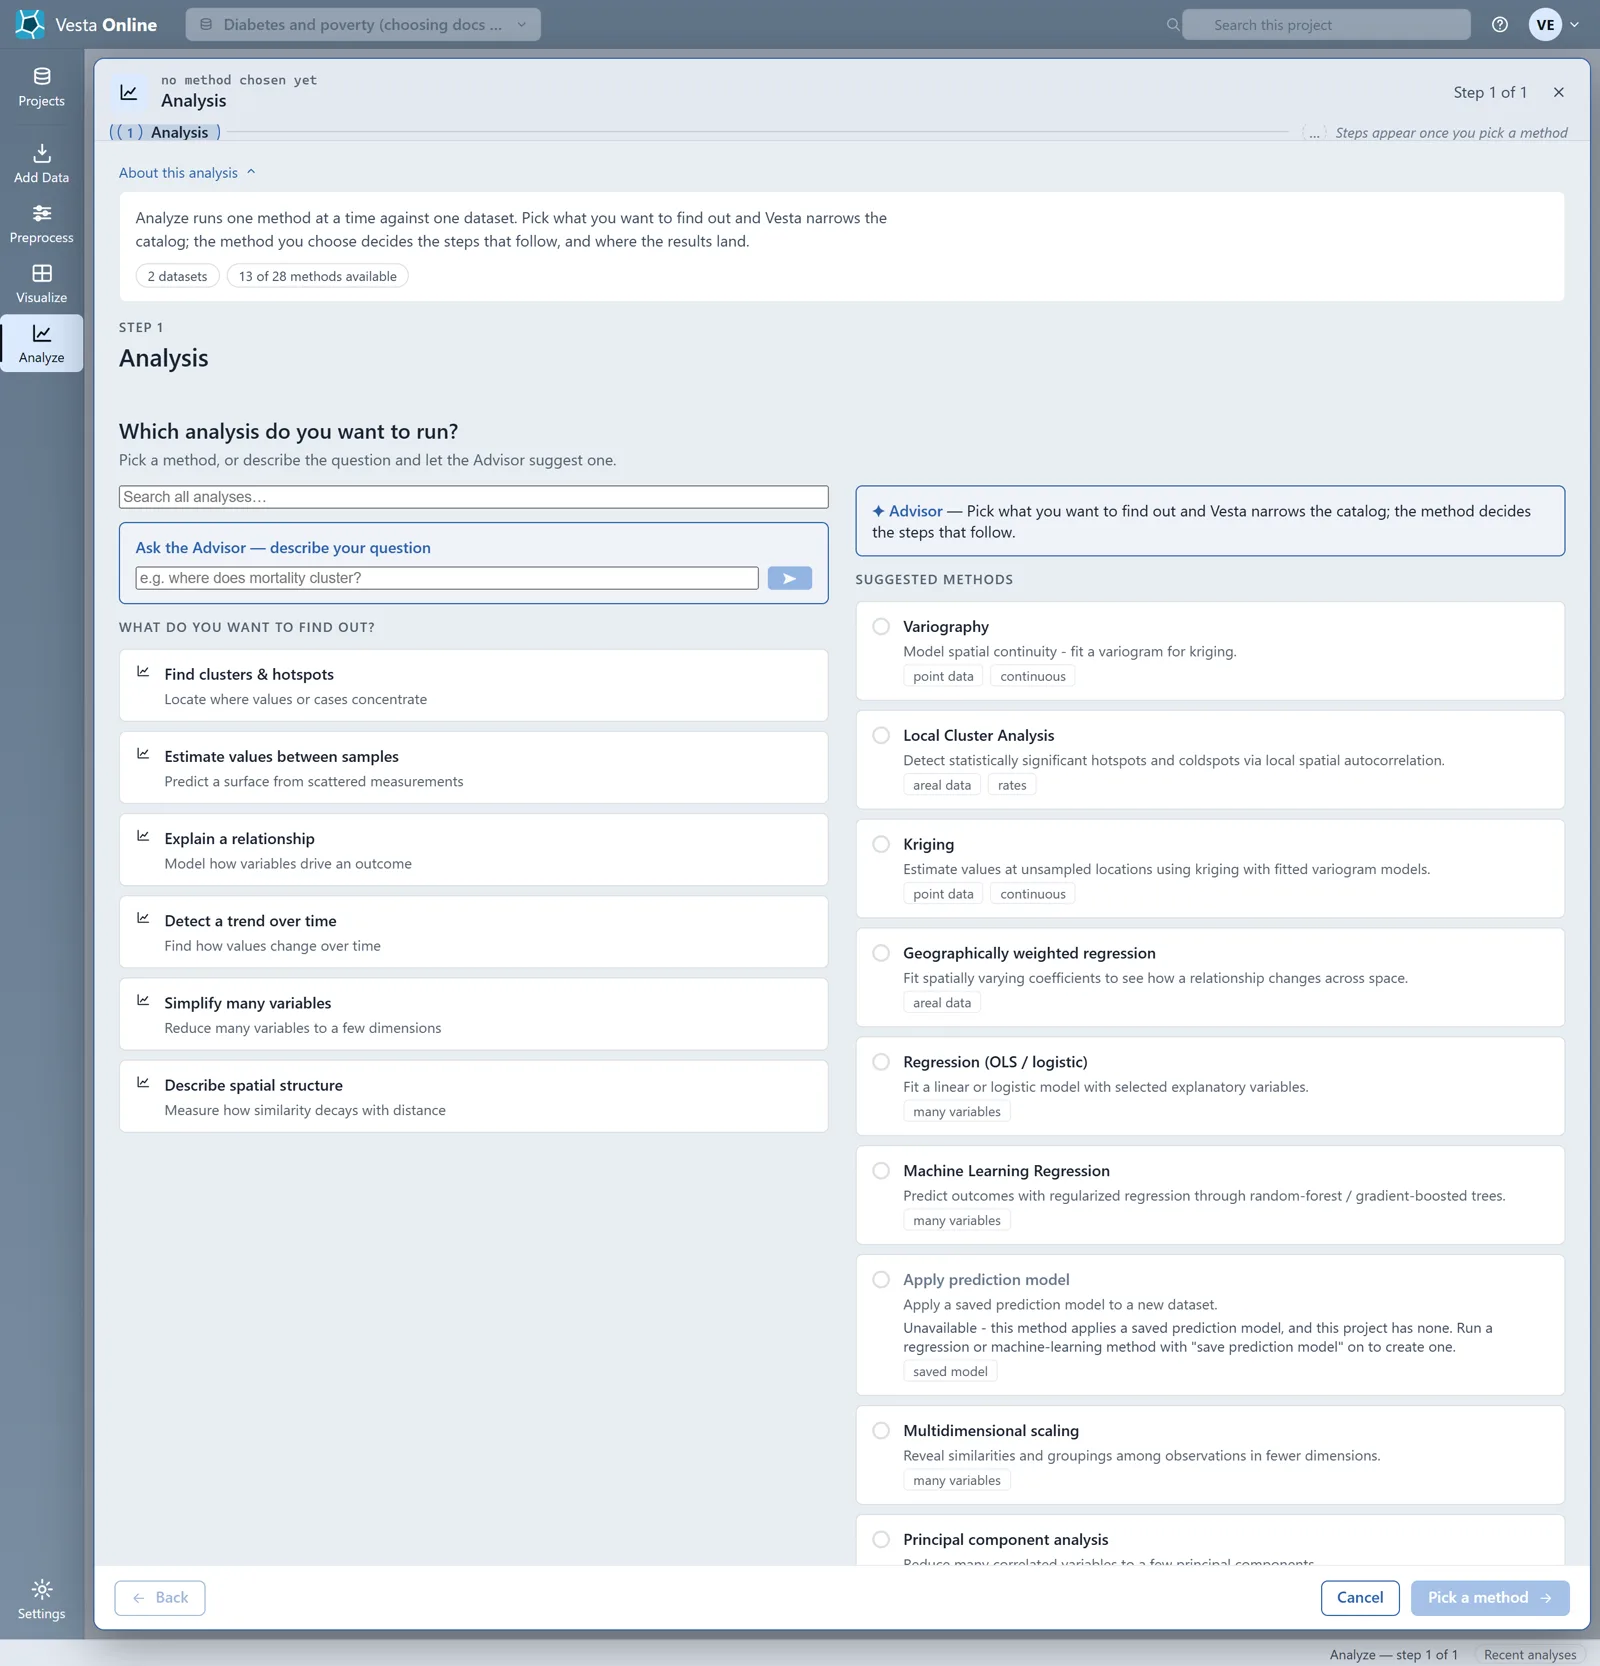
A goal that lists runnable methods
Section titled “A goal that lists runnable methods”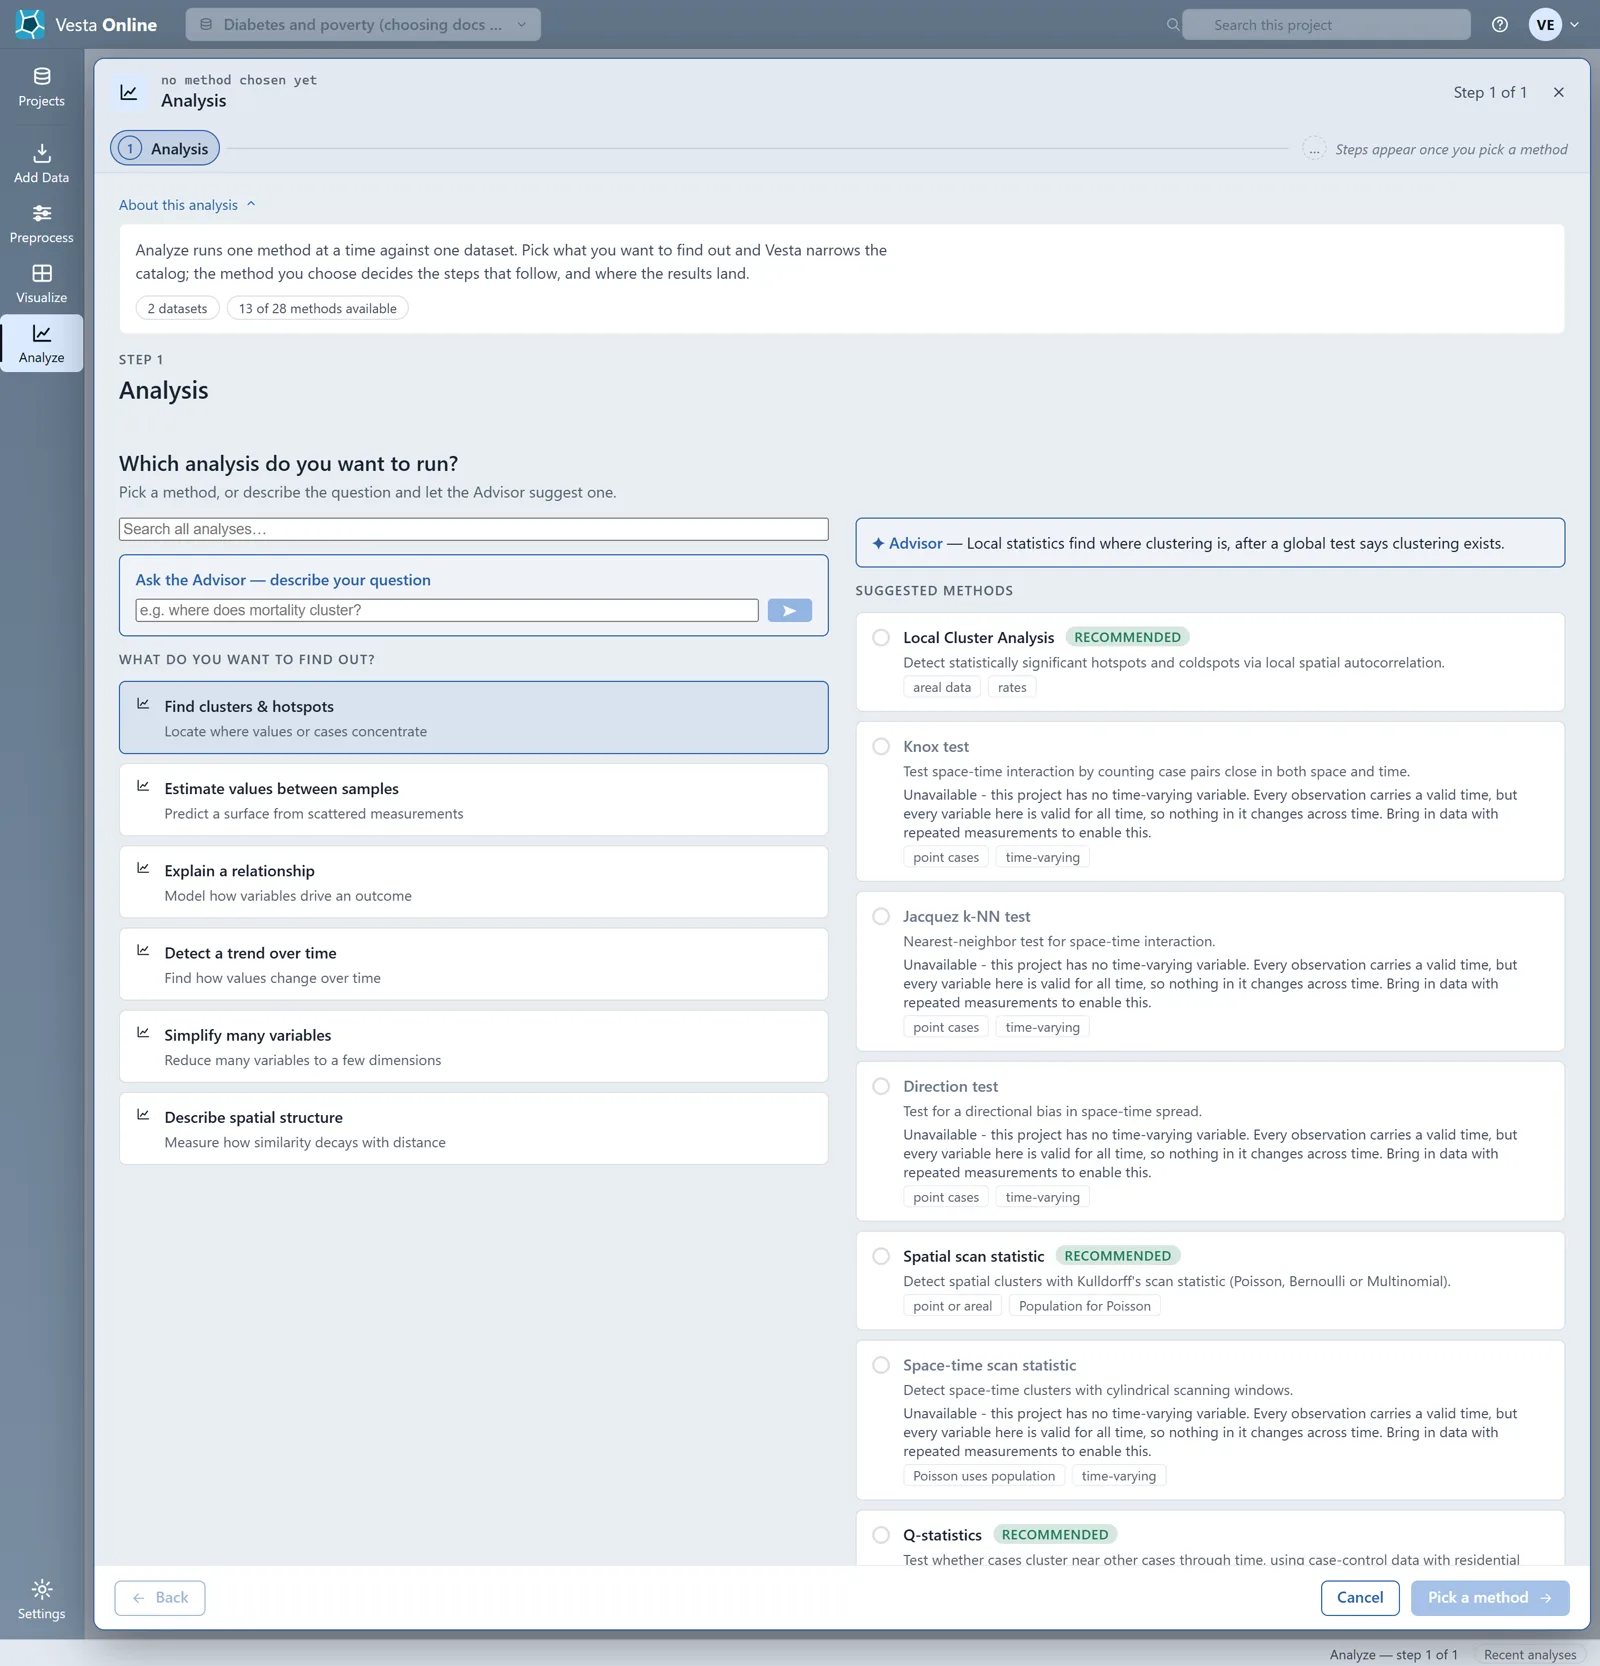
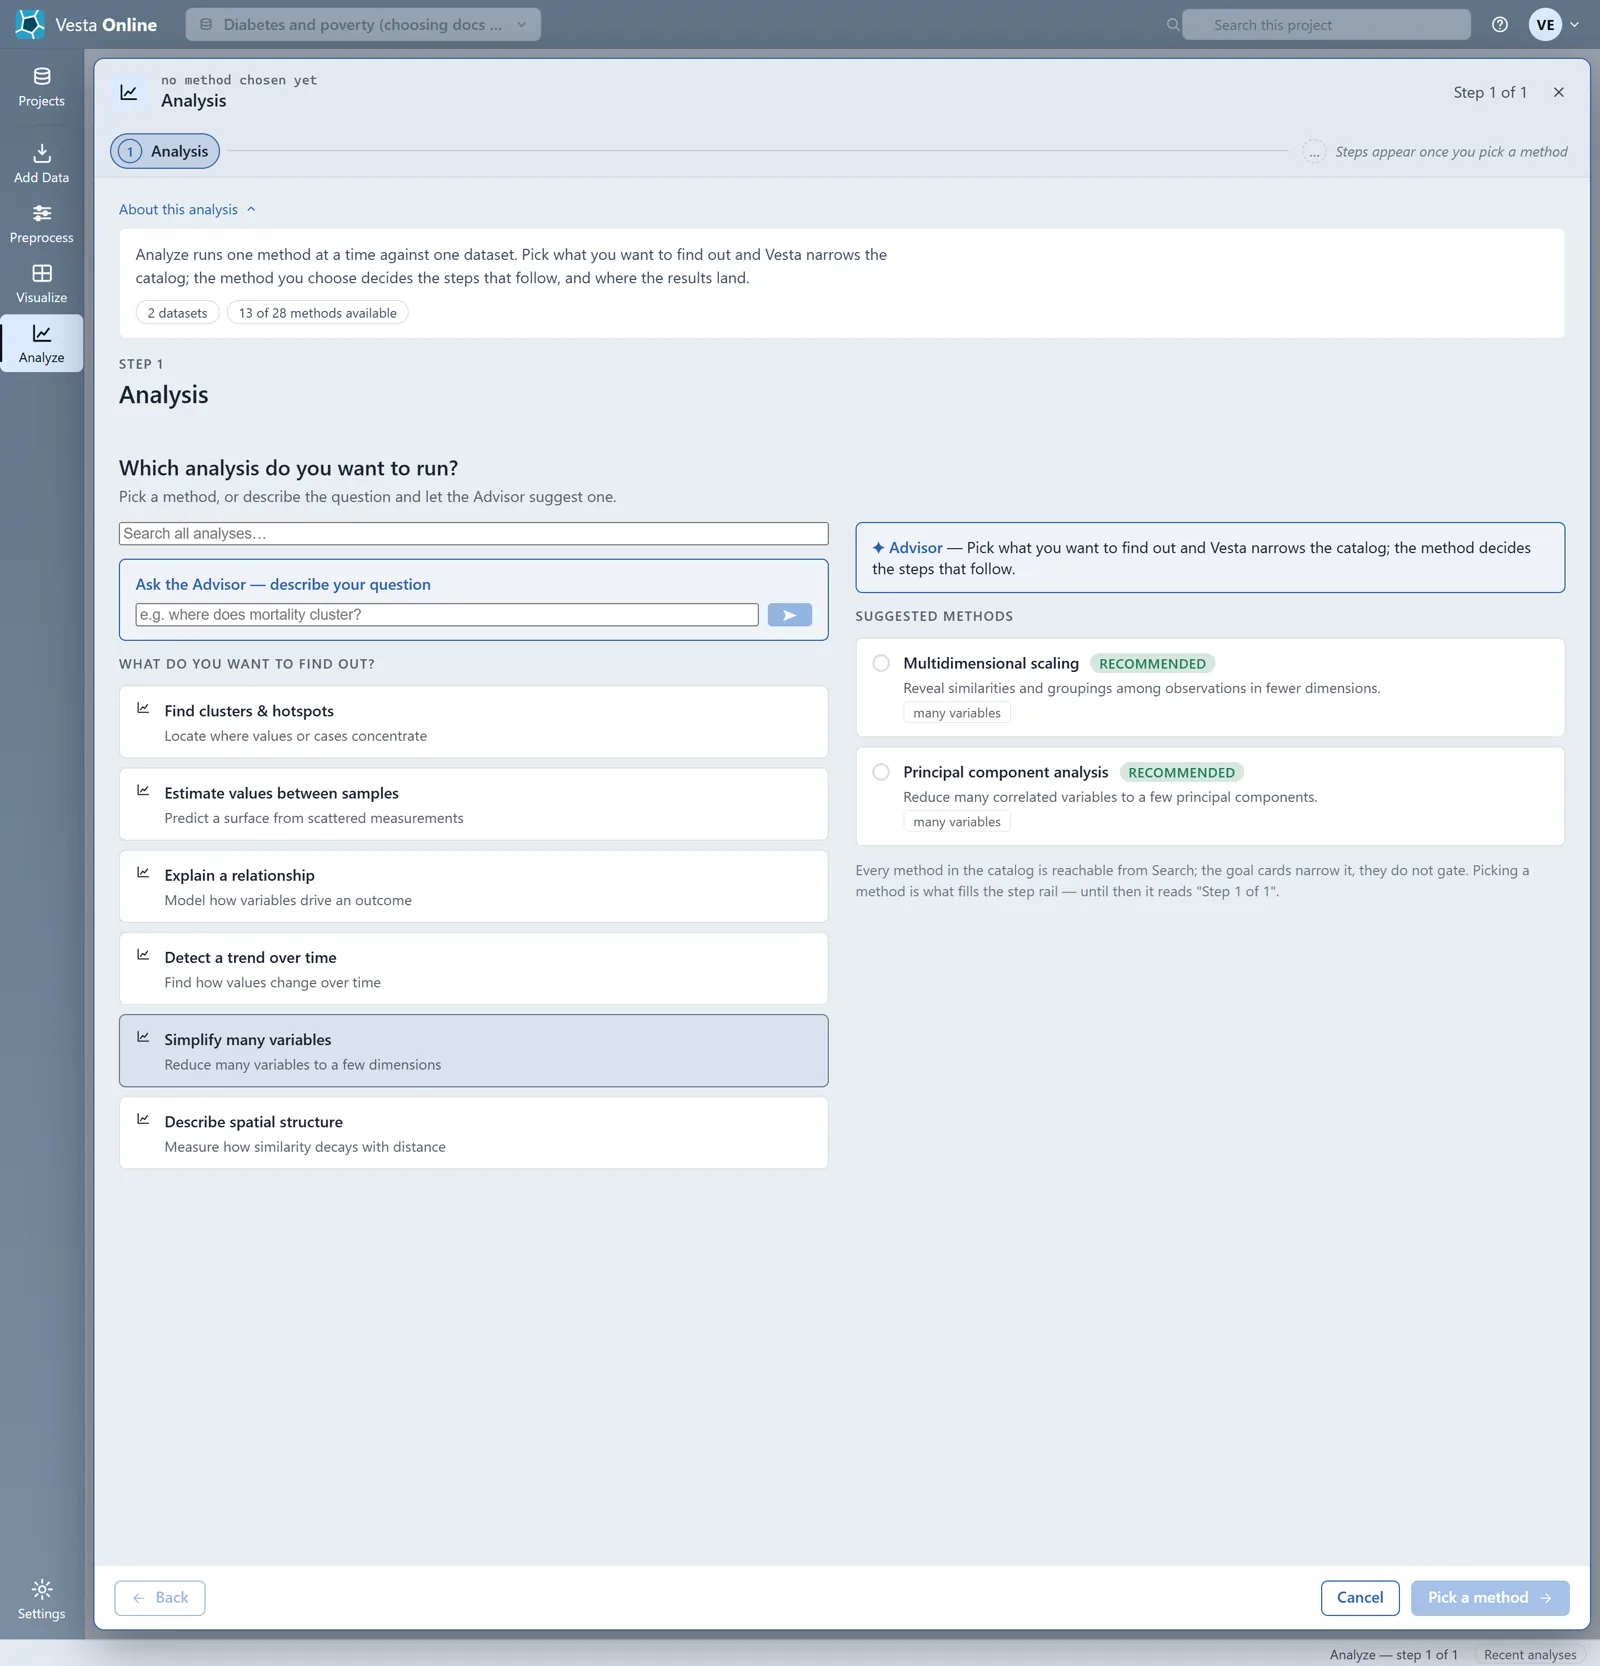
A goal where nothing can run
Section titled “A goal where nothing can run”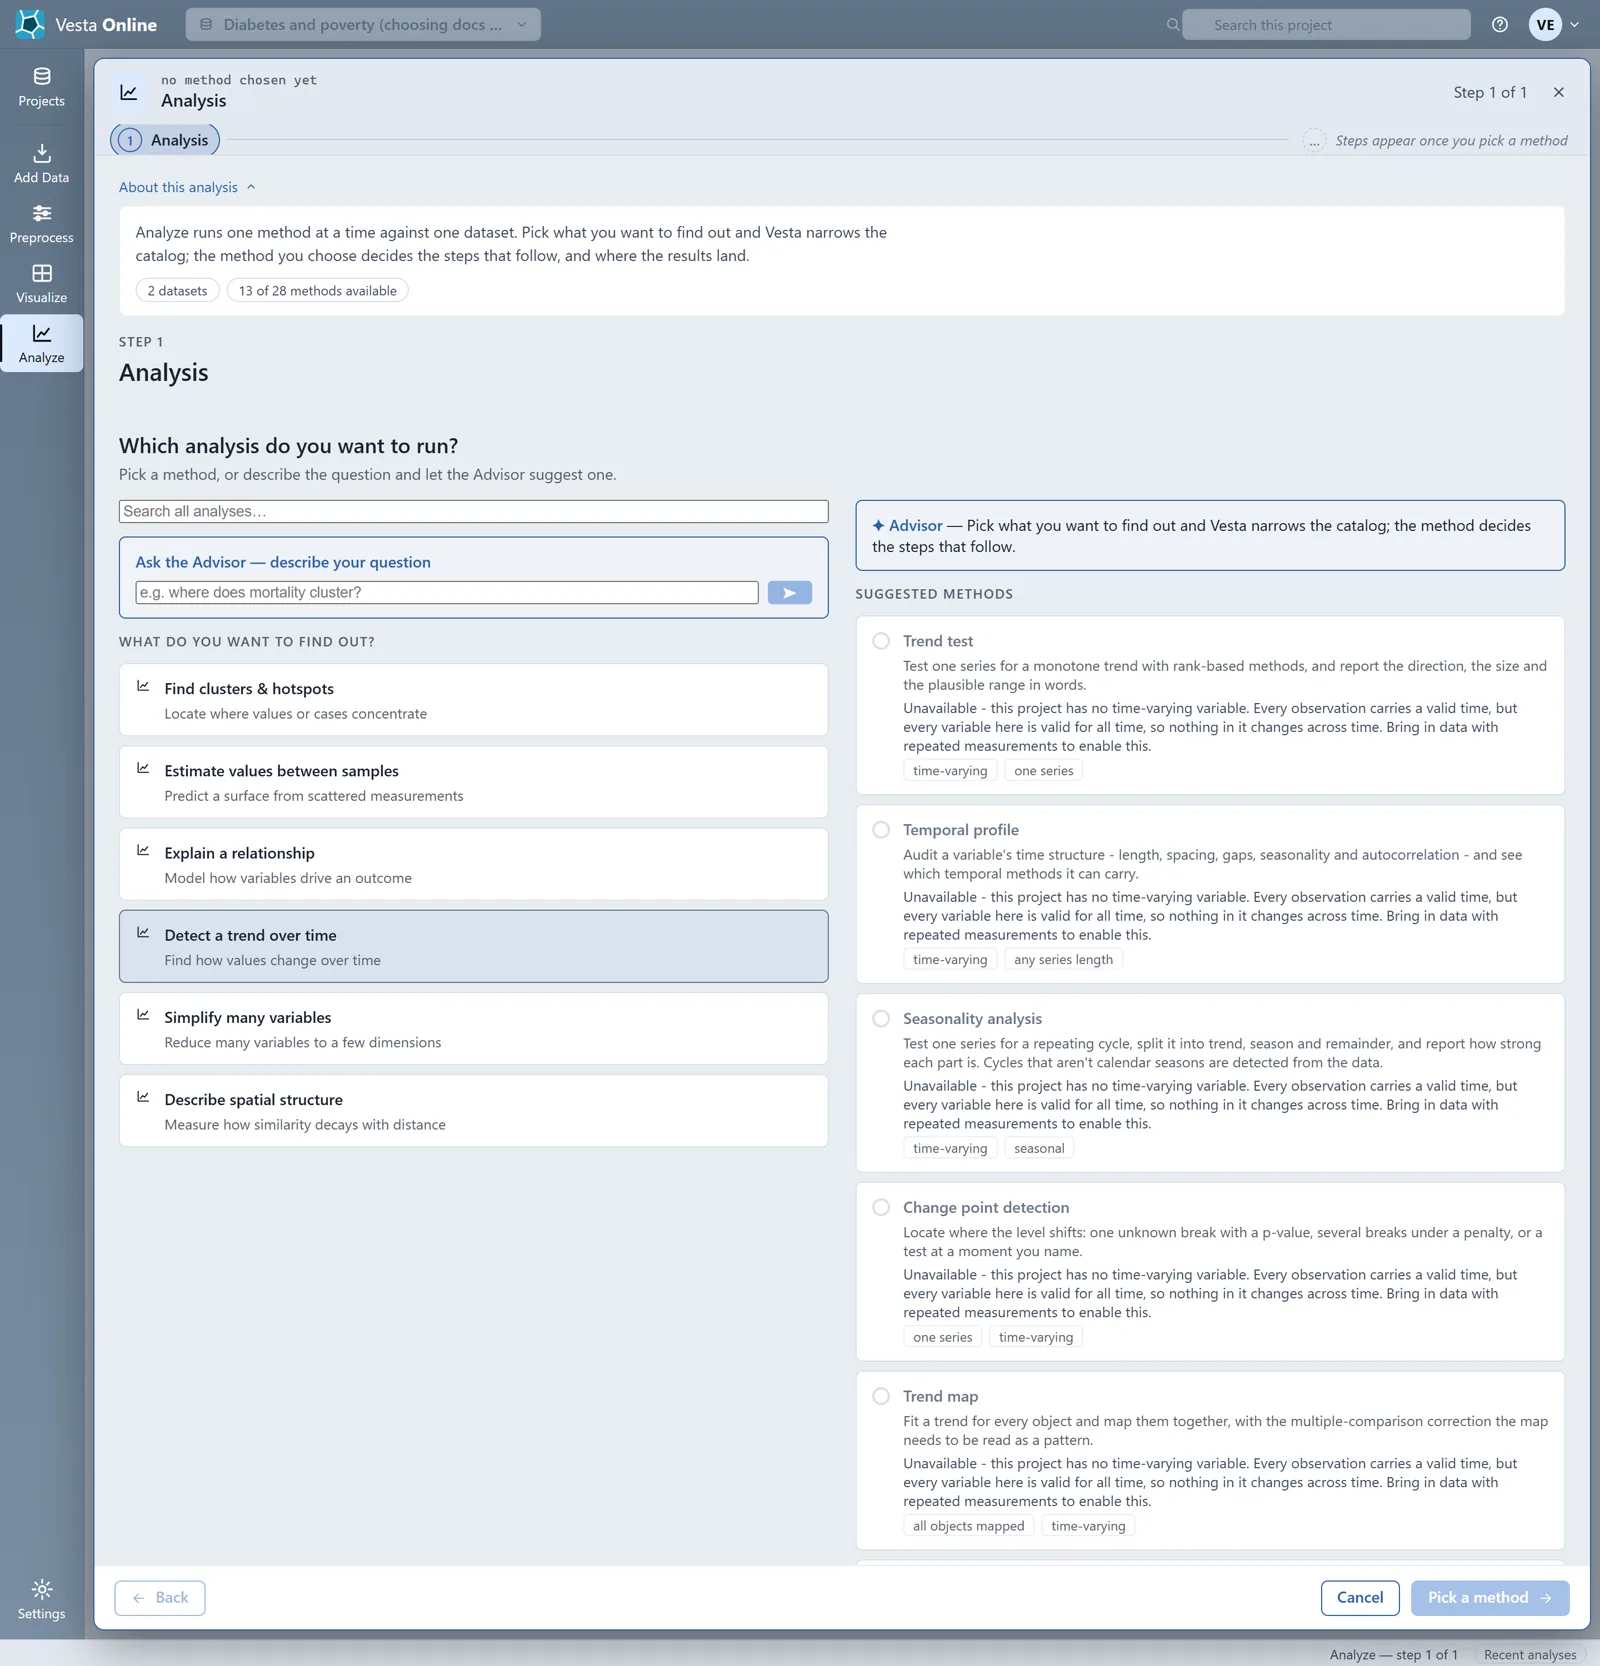
Searching
Section titled “Searching”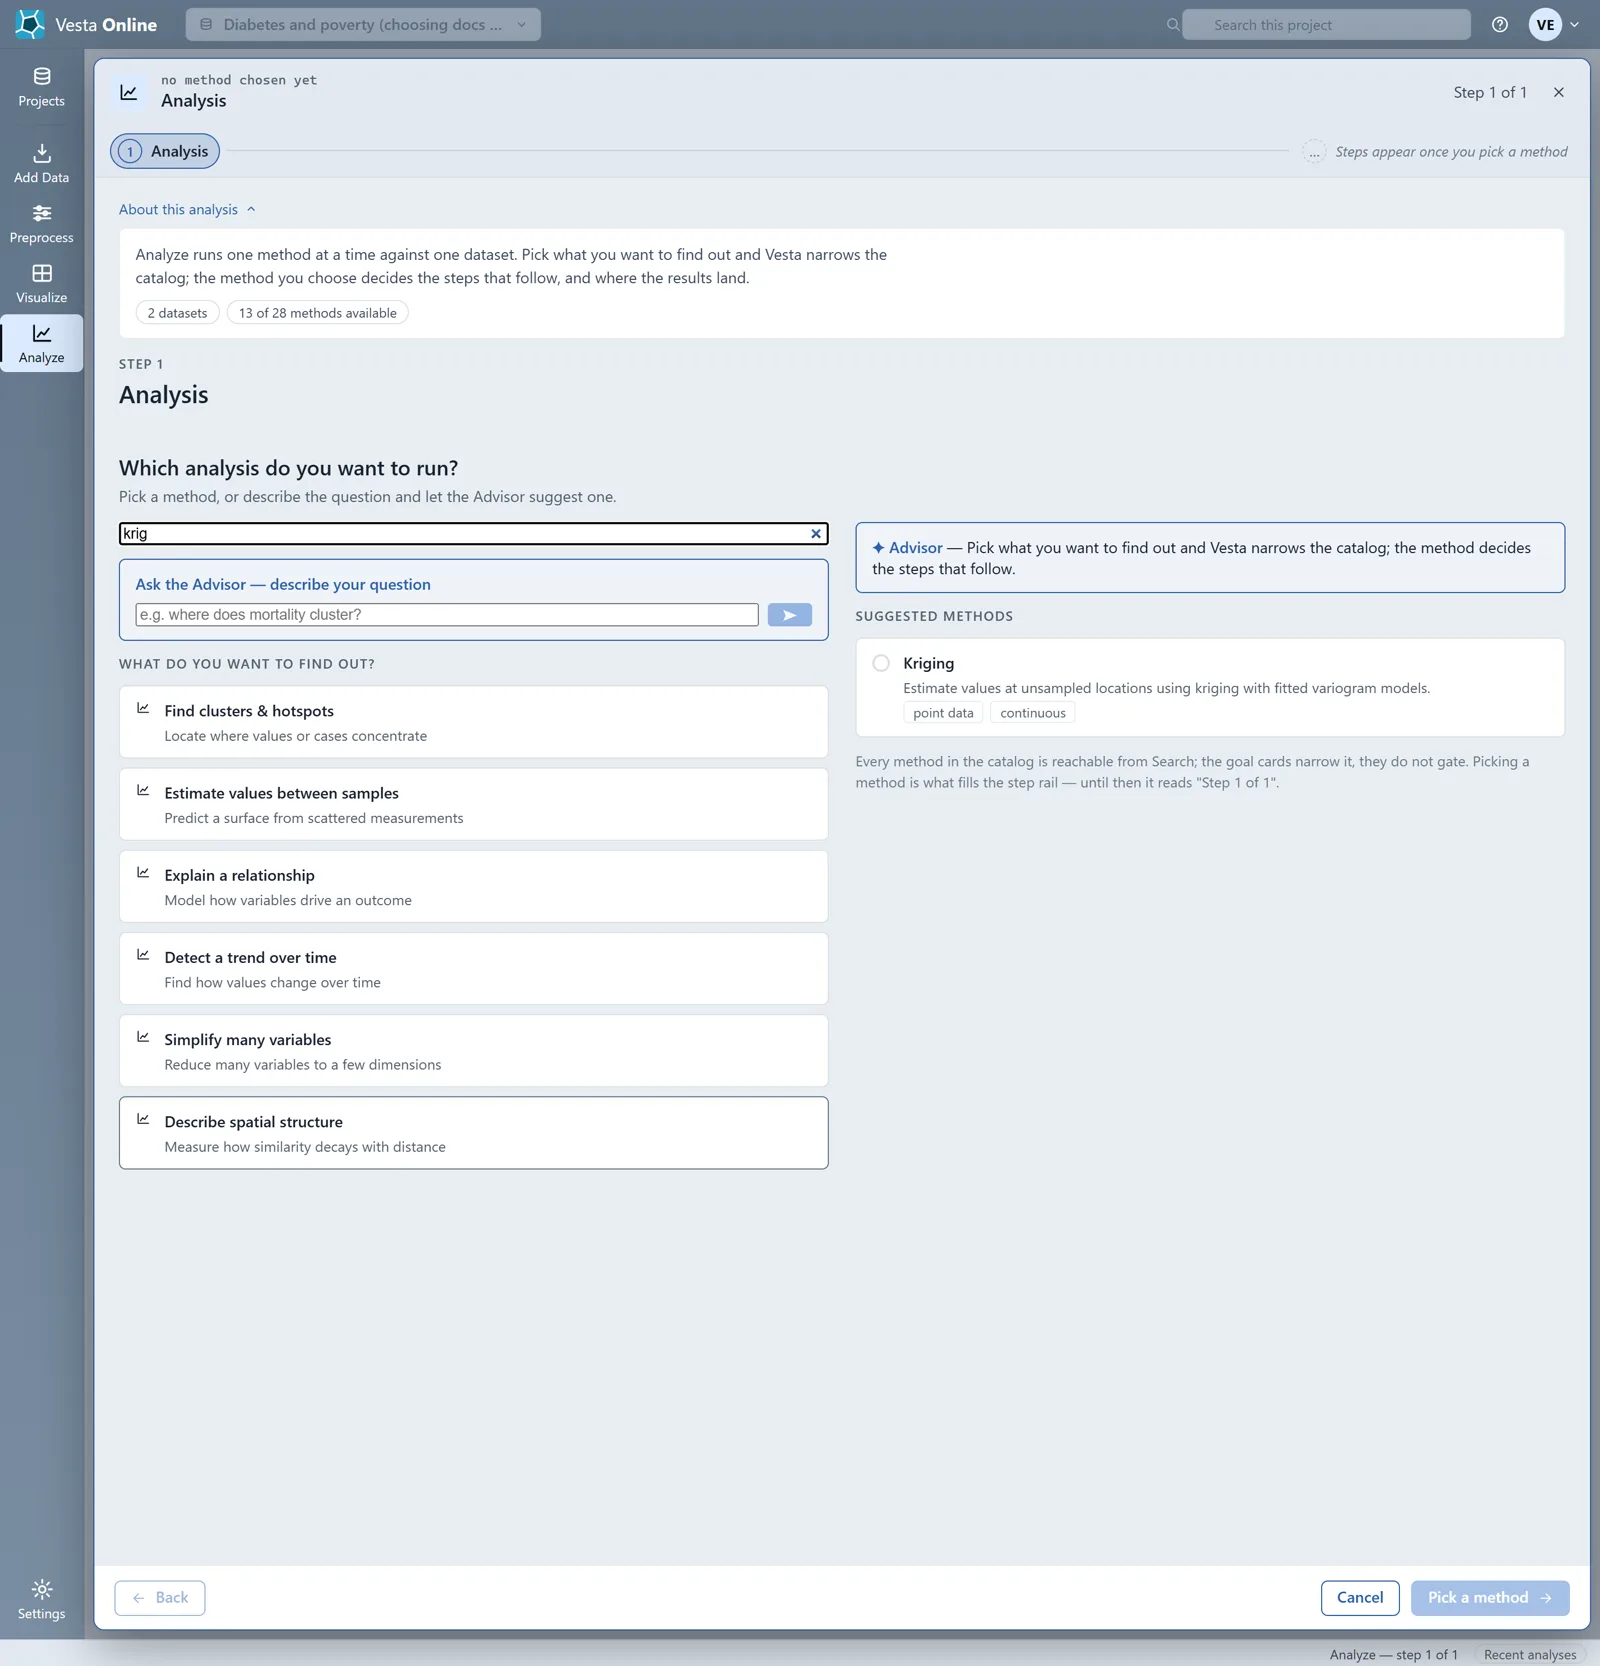
Goals and their methods
Section titled “Goals and their methods”| Goal card | Methods it lists | Read about |
|---|---|---|
| Find clusters & hotspots | Local Cluster Analysis; Spatial scan statistic; Space-time scan statistic; Q-statistics; Knox test; Jacquez k-NN test; Direction test | Local cluster analysis; Scan statistics |
| Estimate values between samples | Kriging | Kriging; Co-kriging |
| Explain a relationship | Regression (OLS / logistic); Geographically weighted regression; Machine Learning Regression; Apply prediction model; Predictor selection; Model comparison; Surface agreement | Regression and GWR |
| Detect a trend over time | Trend test; Temporal profile; Seasonality analysis; Change point detection; Trend map; Trend comparison; Cross-correlation; Temporal scan statistic; Joinpoint regression; Guided trend analysis | Joinpoint regression |
| Simplify many variables | Multidimensional scaling; Principal component analysis | None yet |
| Describe spatial structure | Variography | Variography |
The method articles are Local cluster analysis, Scan statistics, Kriging, Co-kriging, Variography, Regression and GWR and Joinpoint regression.
This table is what the walk showed, in the order the step lists them. A method sits under exactly one goal. Under Explain a relationship, Apply prediction model needs a saved prediction model, which a regression or machine-learning run creates; Predictor selection, Model comparison and Surface agreement are listed there too. Methods without an article are named here only; the step shows a one-line description on each card.
When a method is unavailable
Section titled “When a method is unavailable”Methods the project cannot run stay in the list, grayed, with a sentence from Vesta that says why. In this walk the sentence for the time-based methods was: “Unavailable - this project has no time-varying variable.” It goes on to explain that every variable in this project is valid for all time, and to say that data with repeated measurements enables the method. Apply prediction model said the project had no saved prediction model. So the count in the header, 13 of 28, is for this project: data with repeated measurements enables the time-based methods.
Each card also shows small tags, such as areal data, point data, rates, continuous, many variables or time-varying. They say what the method reads.
Where next
Section titled “Where next”- Find clusters and hotspots: Local cluster analysis.
- Estimate a surface: Kriging.
- Model a relationship: Regression and GWR.
- Changes over time: Joinpoint regression.