Missing data
How missing values enter Vesta Online (blank cells, missing value codes), how maps, tables and statistics show them, and how Local Cluster Analysis labels them.
A missing value is a cell that has no measurement. This article follows one from import to map and analysis: how the import’s Variables step counts blank cells and lists a missing value code, what the Mostly missing warning means, how the Table, the map legend and the Statistics panel show the values that are missing, and how a Local Cluster Analysis labels them. It was run on a small synthetic CSV of 12 made-up sites with blank cells and the placeholder -99 on purpose. Every step below was run on Vesta Online, and the screenshots come from that run. For the whole import wizard, see Importing data.
How missing values come in
Section titled “How missing values come in”Blank cells are always missing, in every file format, whether or not you list a code. A missing value code is a placeholder your file uses for “no data”, such as -99, that you list on the Variables step.
- Open the Variables stepChoose Add Data in the left rail, then From a file on this PC, drop the file and choose Confirm & continue. Choose Next: Geography, Next: Time and Next: Variables. The step is Step 5 of 8 for a file with coordinates. Each column has a Missing box and, under it, a count such as 2 missing · 10 kept. Those counts already include the blank cells, before you list any code. A column that is mostly missing gets a Mostly missing warning: here followup_rate, with 10 of its 12 cells blank, reads 83% of values are missing (10 of 12) and says the variable may not support reliable analysis. The warning appears at 50% or more missing. It does not block the import.
- Add a missing value codeAt the top of the step, Missing value codes — apply to all variables takes a code, here -99. Type it and press Enter; it appears as a chip you can remove. The counts update at once: rate_per_1000 goes from 2 missing · 10 kept to 4 missing · 8 kept, because two of its cells hold -99 and two are blank.
- Review and run the importChoose Next: Review, then Run import. When it finishes, the Summary reports 12 records landed in synthetic-missing.
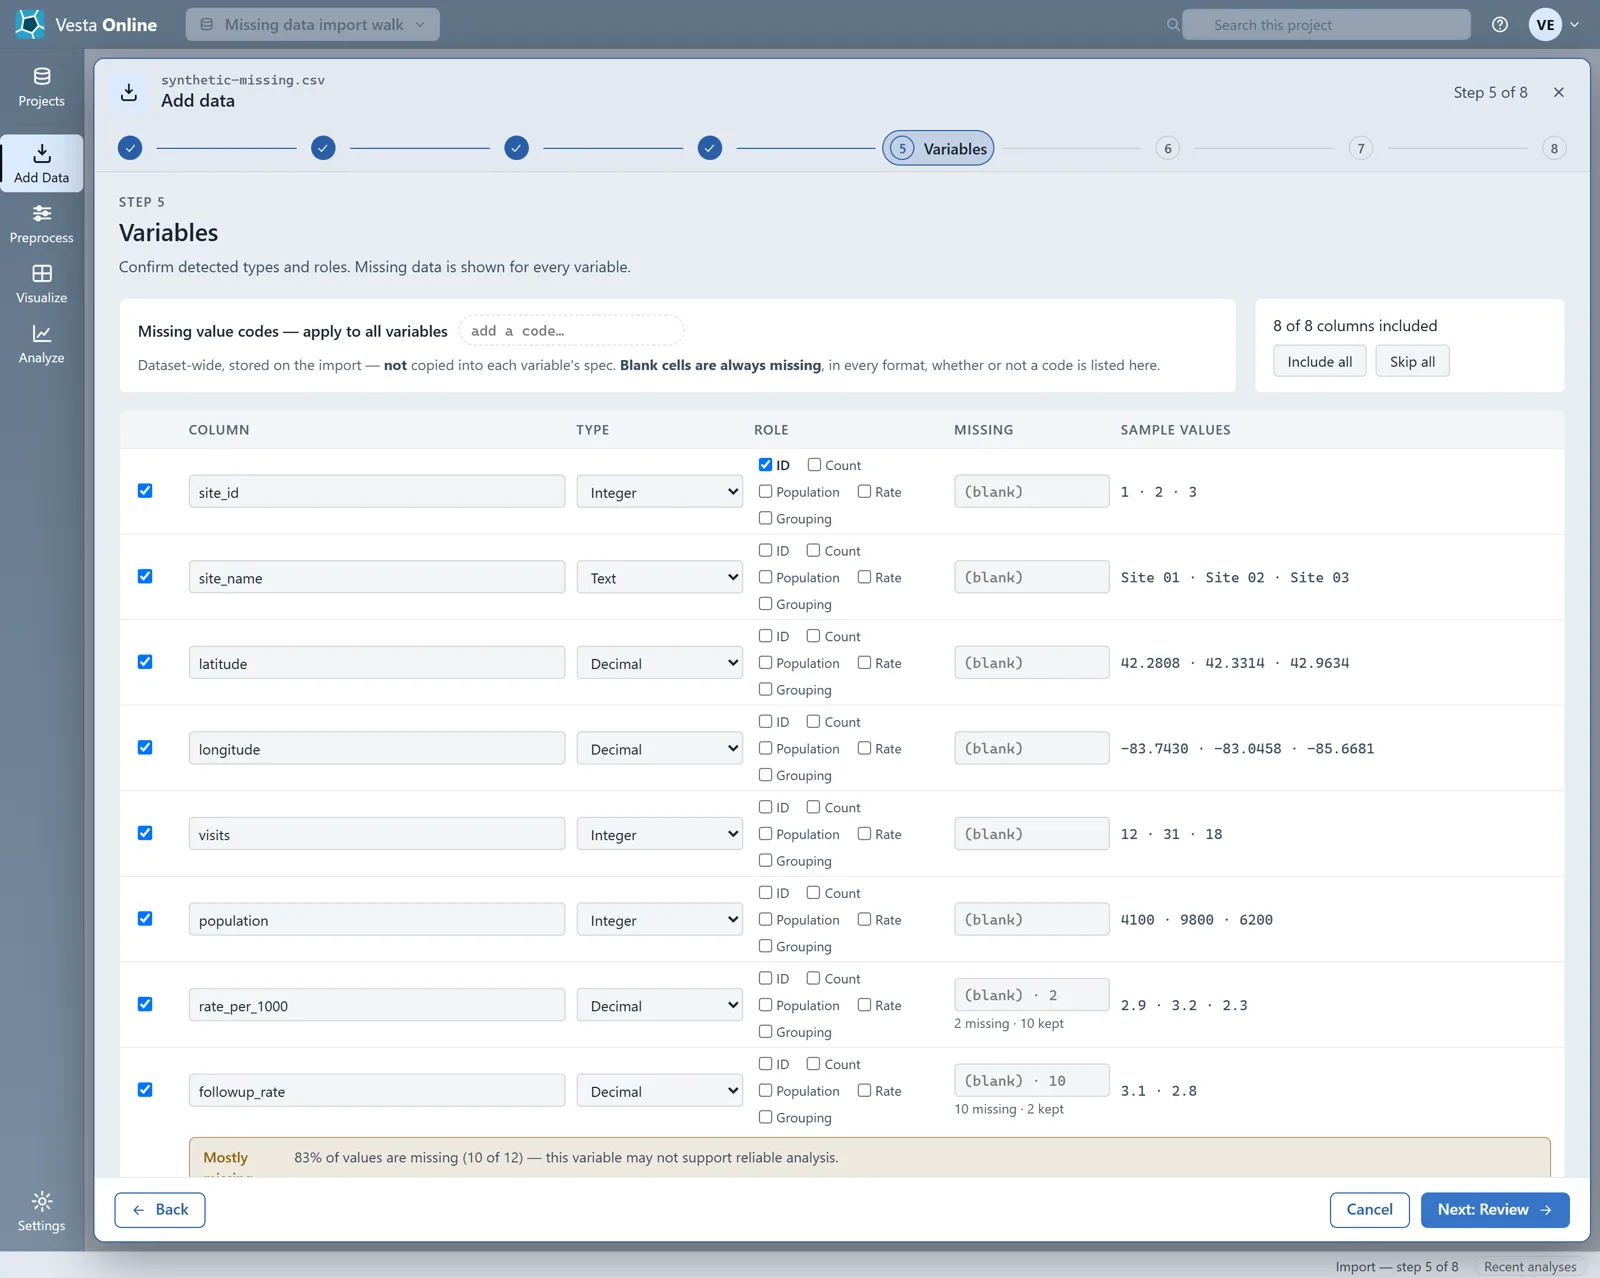
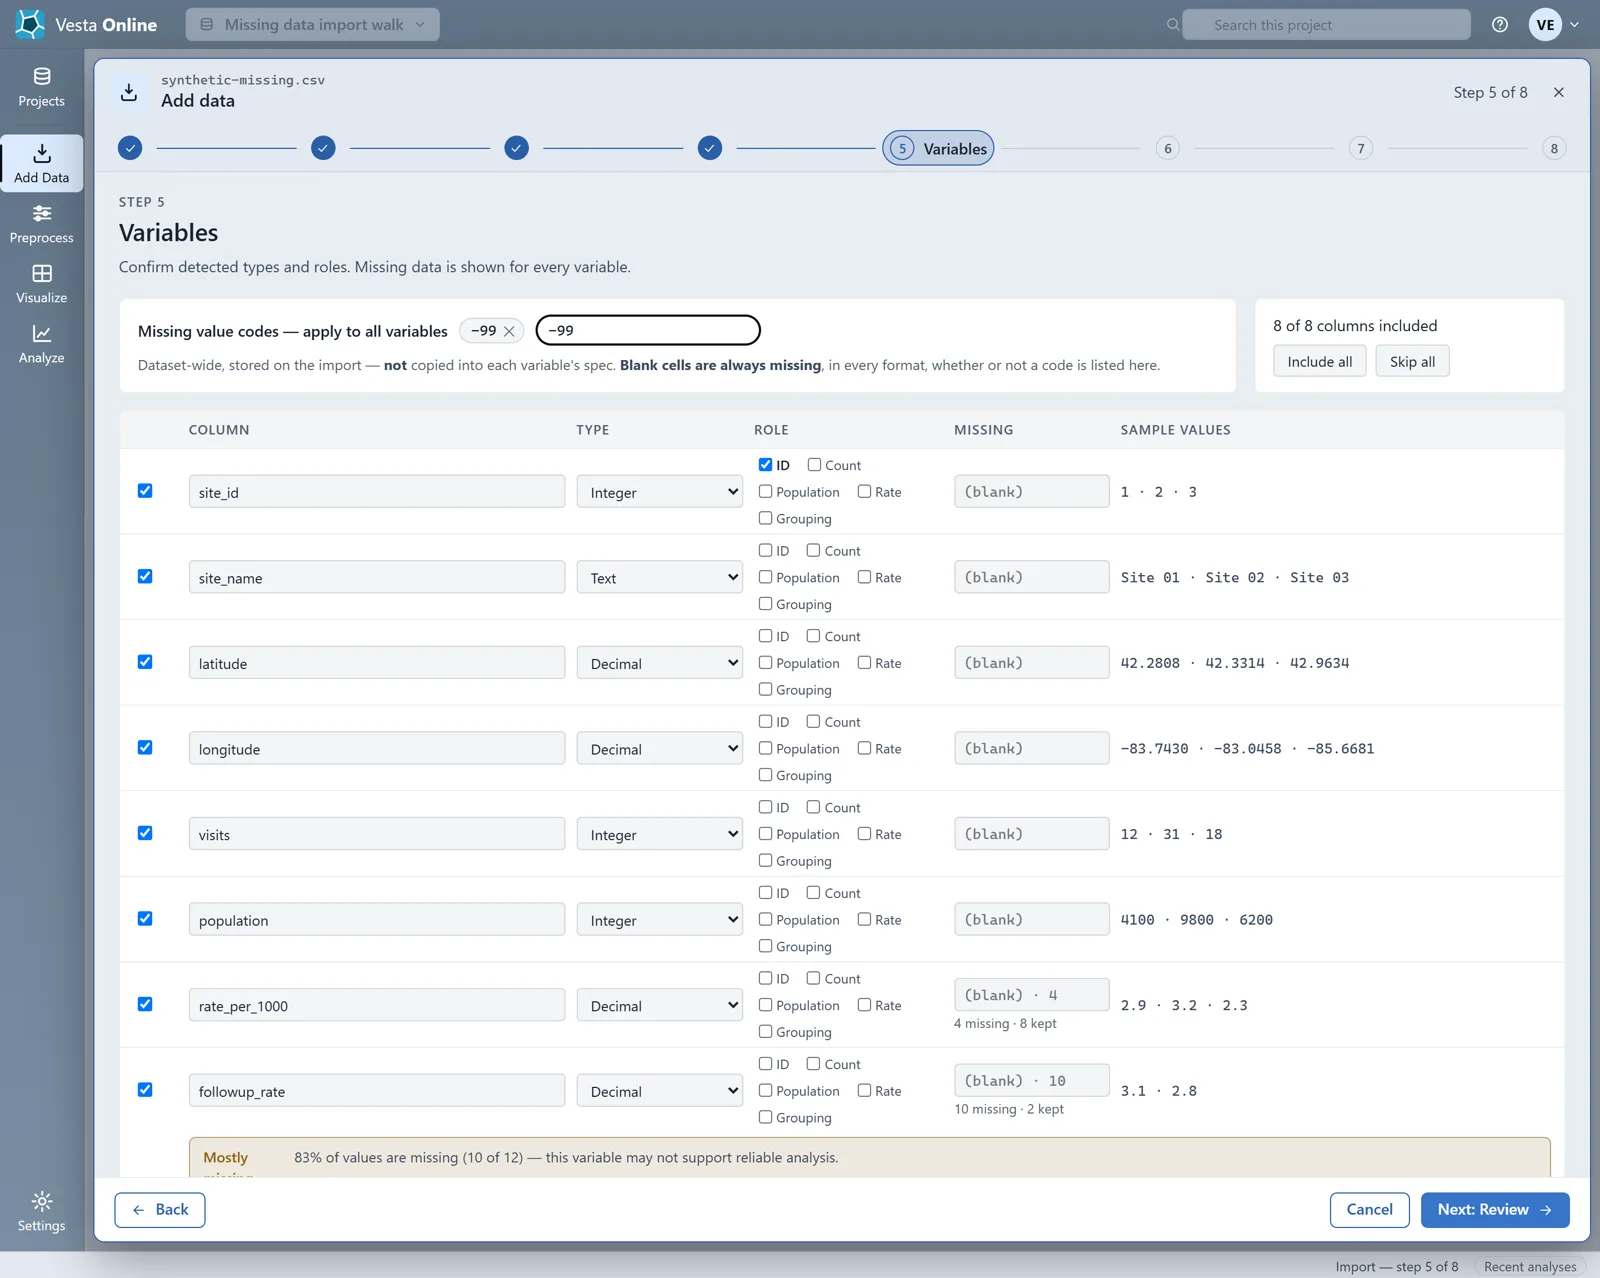
- Blank cell Always missing, in every format, whether or not a code is listed.
- Missing value code A placeholder such as -99 that you list on the Variables step.
- Mostly missing A warning on a column that is 50% or more missing. It informs; it does not stop the import.
- Missing class The Local Cluster Analysis class for an object with no value. An object with a value but no neighbors is not Missing: it is labeled No neighbors in the Cluster Class column.
How a map and the Statistics panel count them
Section titled “How a map and the Statistics panel count them”- Map the variableChoose Visualize, then Explore one variable, pick the variable (here rate_per_1000) and choose Create workspace. The map's legend lists the classes and, last, a Missing row with its count: 4 here. The Missing row is always drawn, even at zero.
- Check the counts in the Data ViewChoose the Data tab on the right and select a variable. Its panel reads Double · 8 values · 4 missing. The Statistics panel counts 8 for rate_per_1000, not 12, and its minimum, maximum and mean come from those 8 values. In the workspace's Table a missing cell shows a dash. That holds for the cells that held -99 and for the blank ones, and no -99 appears anywhere in the Table.
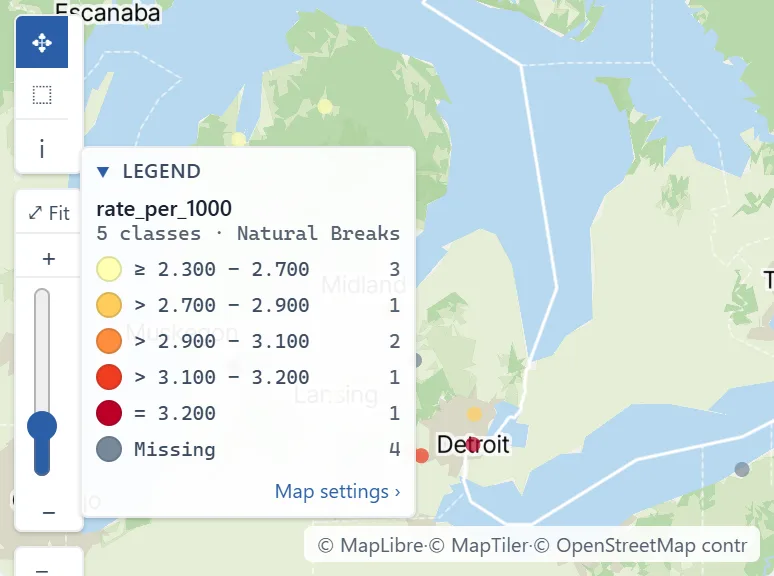
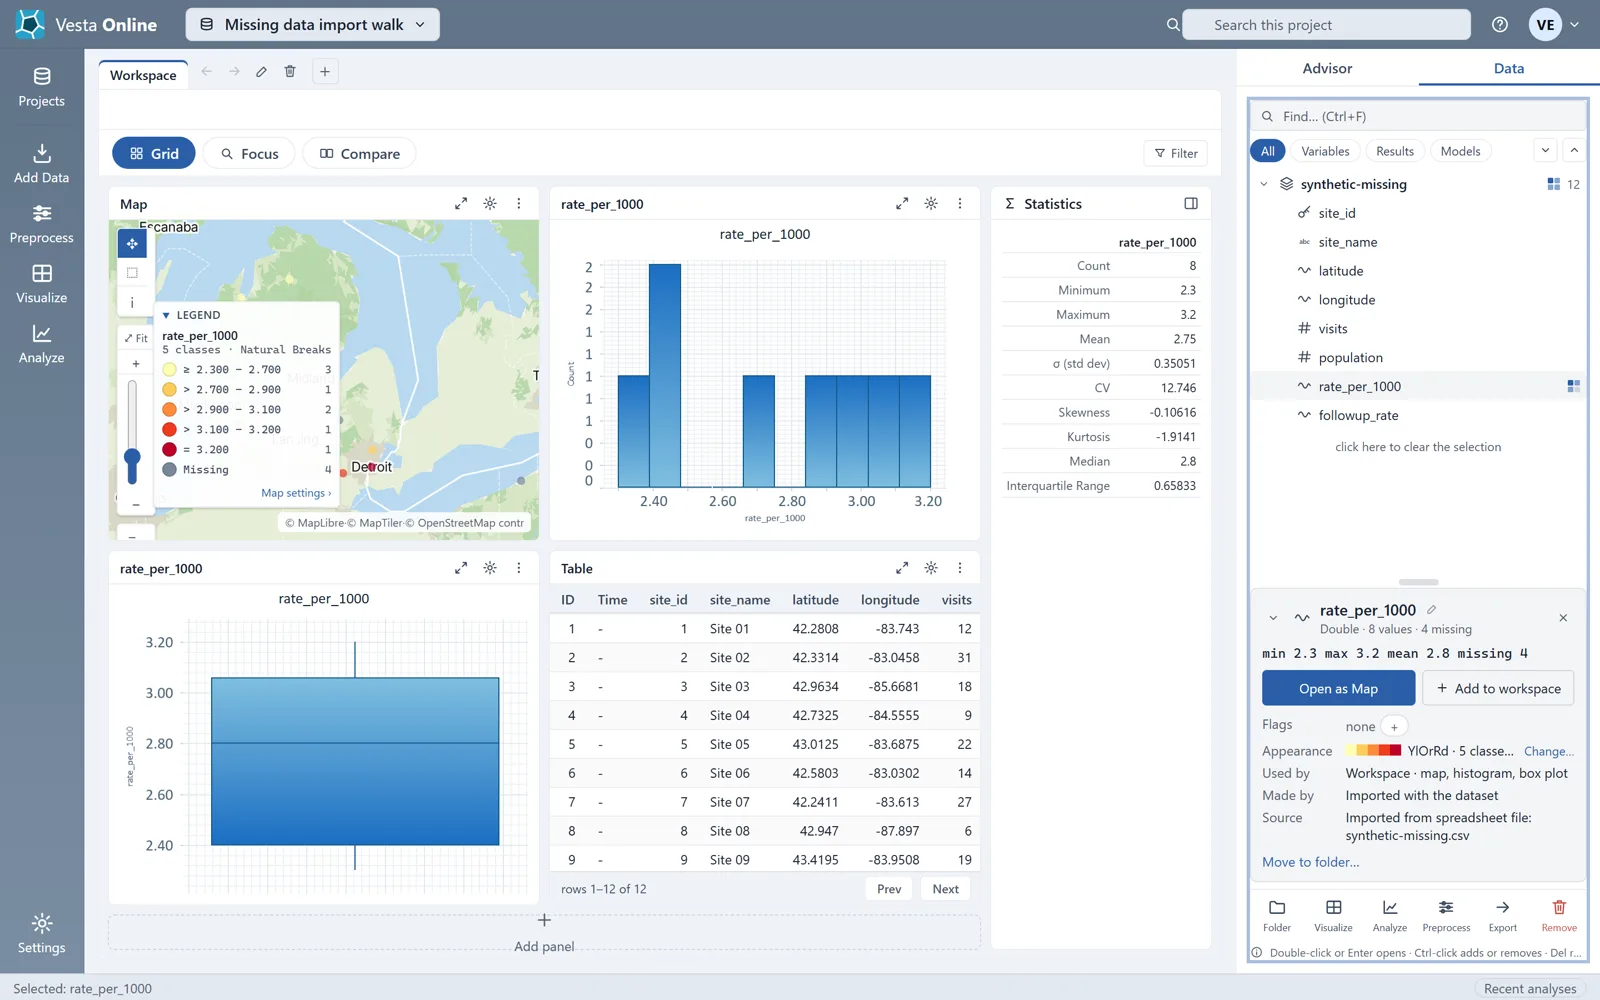
In the maps walked for this article, the Missing swatch was the same slate gray (rgb 119, 136, 153). Whether a map’s Missing color can be changed was not walked.
How a Local Cluster Analysis treats them
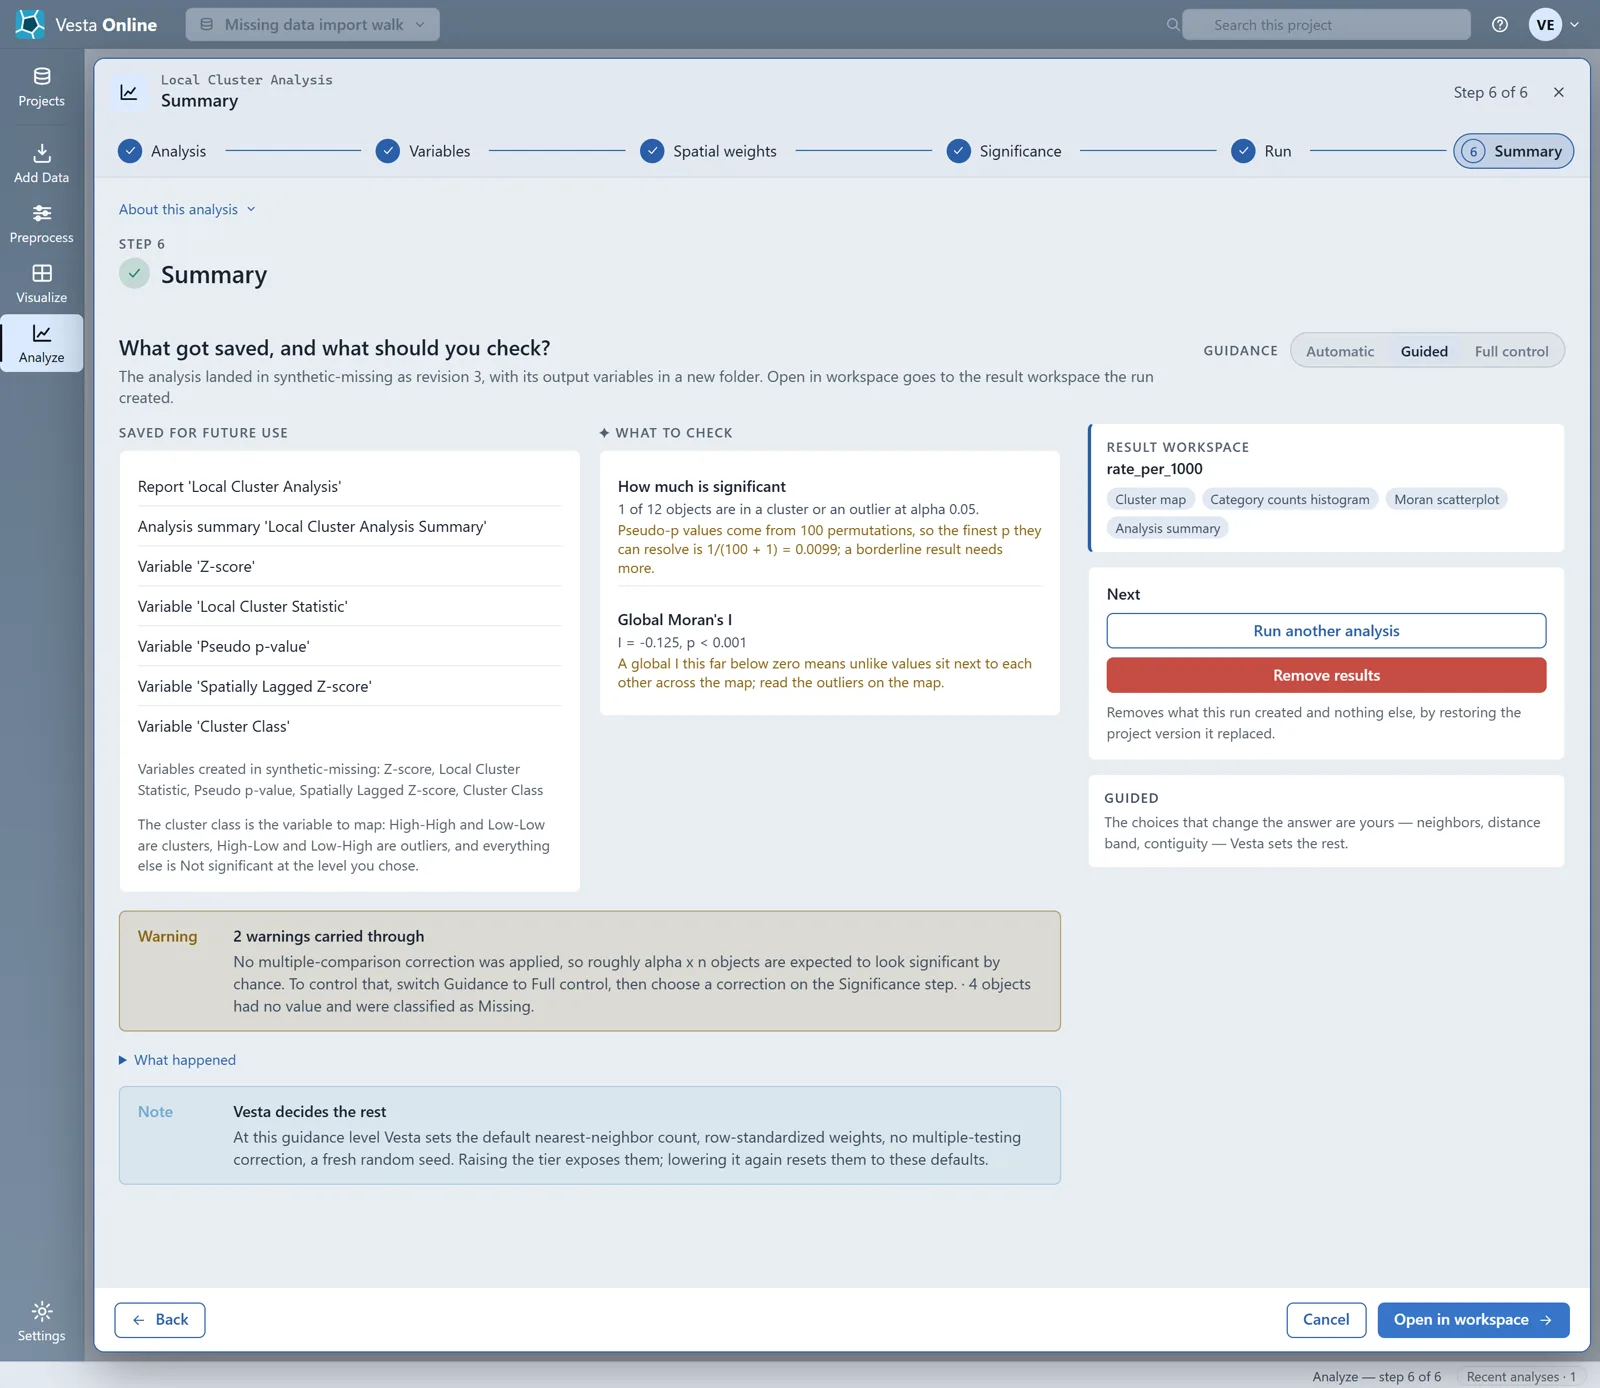
Section titled “How a Local Cluster Analysis treats them”- Run a Local Cluster AnalysisChoose Analyze, Find clusters & hotspots, then Local Cluster Analysis. Pick the dataset (here synthetic-missing) and the variable rate_per_1000, and keep the detected neighbors and the default significance. The Variables step says it plainly: objects with a missing value are left out of the analysis, not treated as zero. When the run finishes, its Summary warns that 4 objects had no value and were classified as Missing. The seed is fresh each run, so the number of clustered sites can differ from run to run; the 4 Missing sites do not.
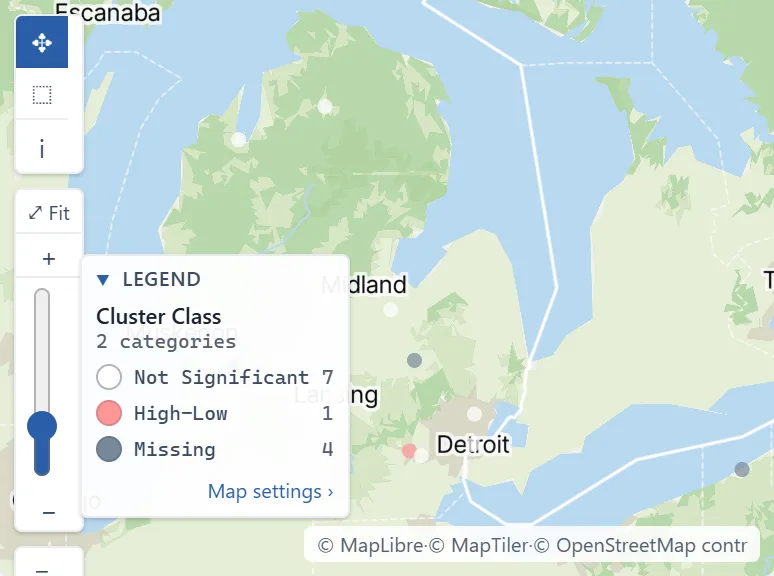
- Find the Missing classChoose Open in workspace. The cluster map's legend lists the cluster classes and a Missing row. Here it reads 4, the four sites that have no rate_per_1000 value, and the classes add up to all 12 sites.
A county with a value can also go unclassified when it has no neighbors. The Diabetes and poverty sample has 3,109 counties and every one has a diabetes value. A new Local Cluster Analysis on a copy of it warns that 4 objects have no neighbors under queen contiguity and were not classified. Queen contiguity is the default for polygons; the Use rook contiguity option changes it. The Cluster Class column of that run labels exactly four counties No neighbors: Dukes and Nantucket in Massachusetts, Richmond in New York and San Juan in Washington. In the sample’s saved Cluster Class column, read before the new run, the same four counties are blank.
What this page did not cover
Section titled “What this page did not cover”| Not walked | Notes |
|---|---|
| Other file formats | Blank cells are missing in every format, from the Variables step's own text. The walk imported a CSV only. |
| Changing a code after import | The walk did not look for a way to do it. |
| Charts, exports and other analyses | How each one treats a missing value is not described here. The Table, the Statistics panel, the map legend and the Local Cluster Analysis are the only ones walked. |
Where next
Section titled “Where next”- The whole import wizard, step by step: Importing data.
- Find clusters and hotspots in county data: Local cluster analysis.
- A first map and analysis: Quickstart.