Exporting data and pictures
Save a dataset as CSV or a Shapefile, a map or chart as a PNG or JPEG picture, and a table or chart's numbers as CSV from Vesta Online.
Vesta Online saves two kinds of files: your data, from the Data tab or from a table or chart panel, and pictures of what a panel shows. Exporting needs a signed-in account: a signed-out visitor and a read-only link reader see the Export entry switched off. Every step below was run on Vesta Online, on copies of the Diabetes and poverty and Ohio overdose trends sample projects, and the screenshots come from that run. The browser saves each file into its own downloads folder.
Export a dataset from the Data tab
Section titled “Export a dataset from the Data tab”- Open the Data tab and select a datasetOpen a project and choose the Data tab in the side pane. Click a dataset's row to select it; here that is US counties in the Diabetes and poverty copy, with 3,109 objects. The strip at the foot of the pane shows Folder, Visualize, Analyze, Preprocess, Export and Remove.
- Choose ExportChoose Export. The Export as… box lists the formats that fit the dataset. A dataset with map shapes, like this one, offers CSV and Shapefile. A dataset without map shapes offers CSV only, and a raster dataset offers GeoTIFF only.
- Save the rows as CSVChoose CSV. The browser downloads US counties.csv, and the status line at the foot of the window reads Exported US counties.csv. The file has a header row of 19 column names and 3,109 data rows, one per county. A cell with no value is empty. In this sample's stored Local Cluster Analysis result, four island counties (no neighboring county) have no Local Cluster Statistic, Pseudo p-value, Spatially Lagged Z-score or Cluster Class, and those four cells are empty in each of those columns. That is the stored result: a new Local Cluster Analysis gives those counties the class No neighbors, not an empty cell.
- Save the shapes as a ShapefileSelect the dataset again, choose Export and choose Shapefile. The download is US counties.zip, 14,279,007 bytes in this run. It holds the five files of a Shapefile: .shp, .shx, .dbf, .prj and .cpg.
- Choose the times to exportWhen a dataset has more than one time and the format is not GeoTIFF, Vesta first asks Which times do you want to export? and offers Current time only and All times. The Ohio counties dataset has 88 objects and 19 times. Current time only gave a CSV of 88 rows; All times gave 1,672 rows, which is 88 counties for each of 19 years, with a Time column. Diabetes and poverty has a single time, so it asked nothing.
What you should see
Section titled “What you should see”The Data tab
Section titled “The Data tab”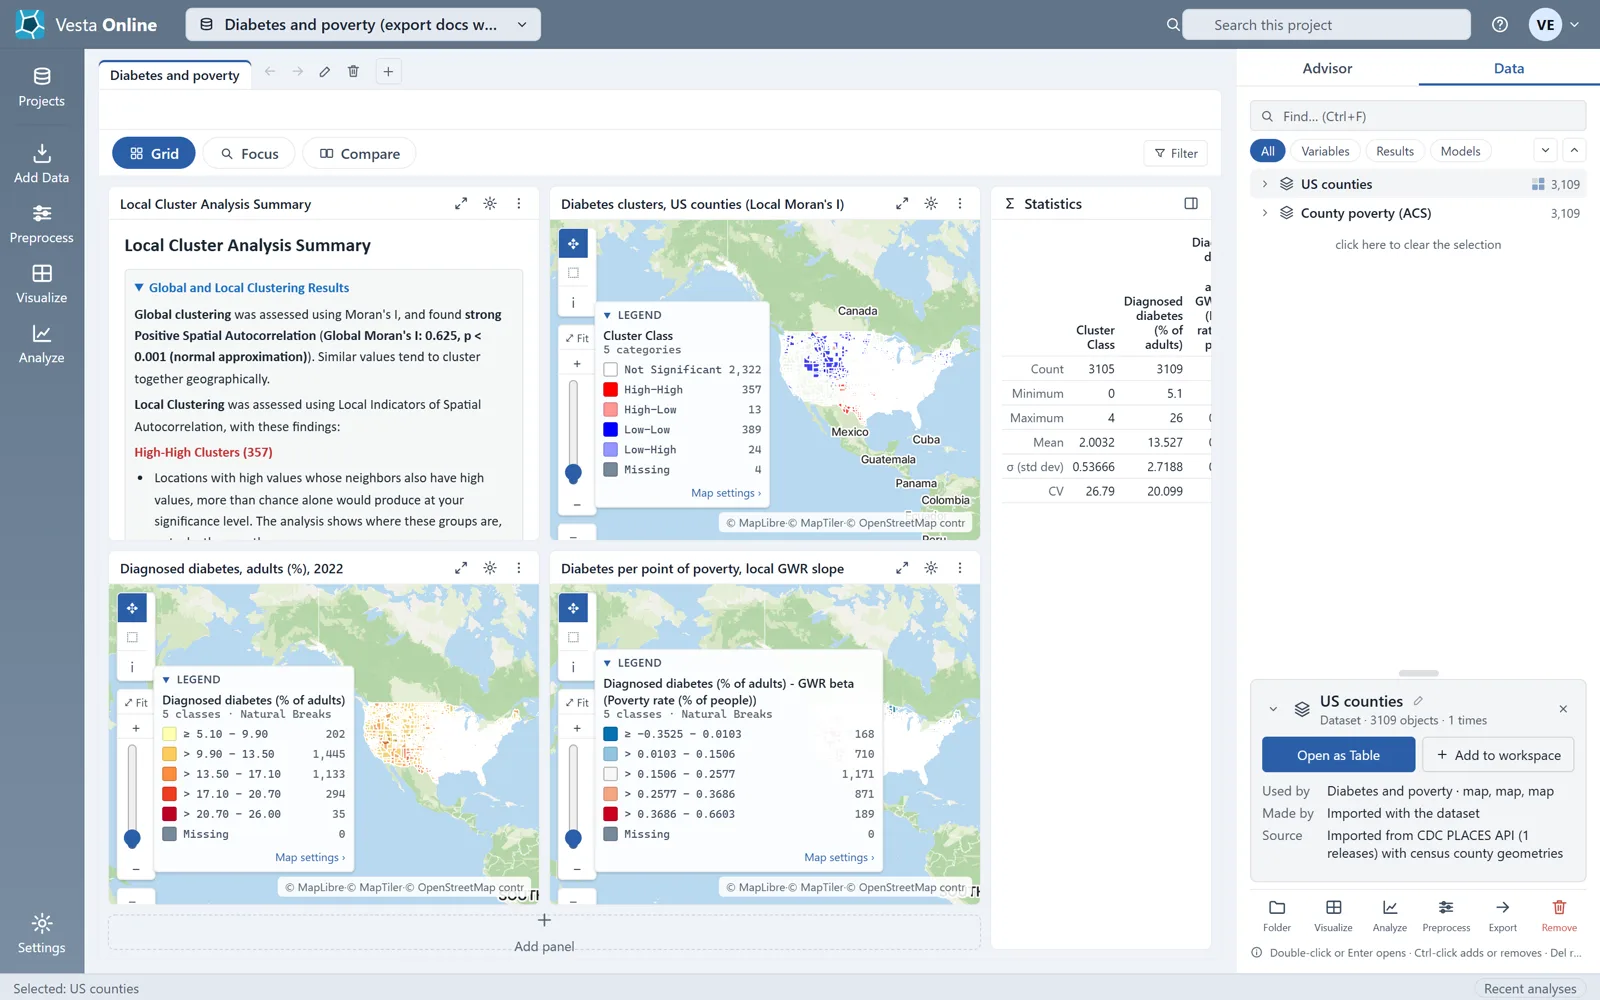
The format box
Section titled “The format box”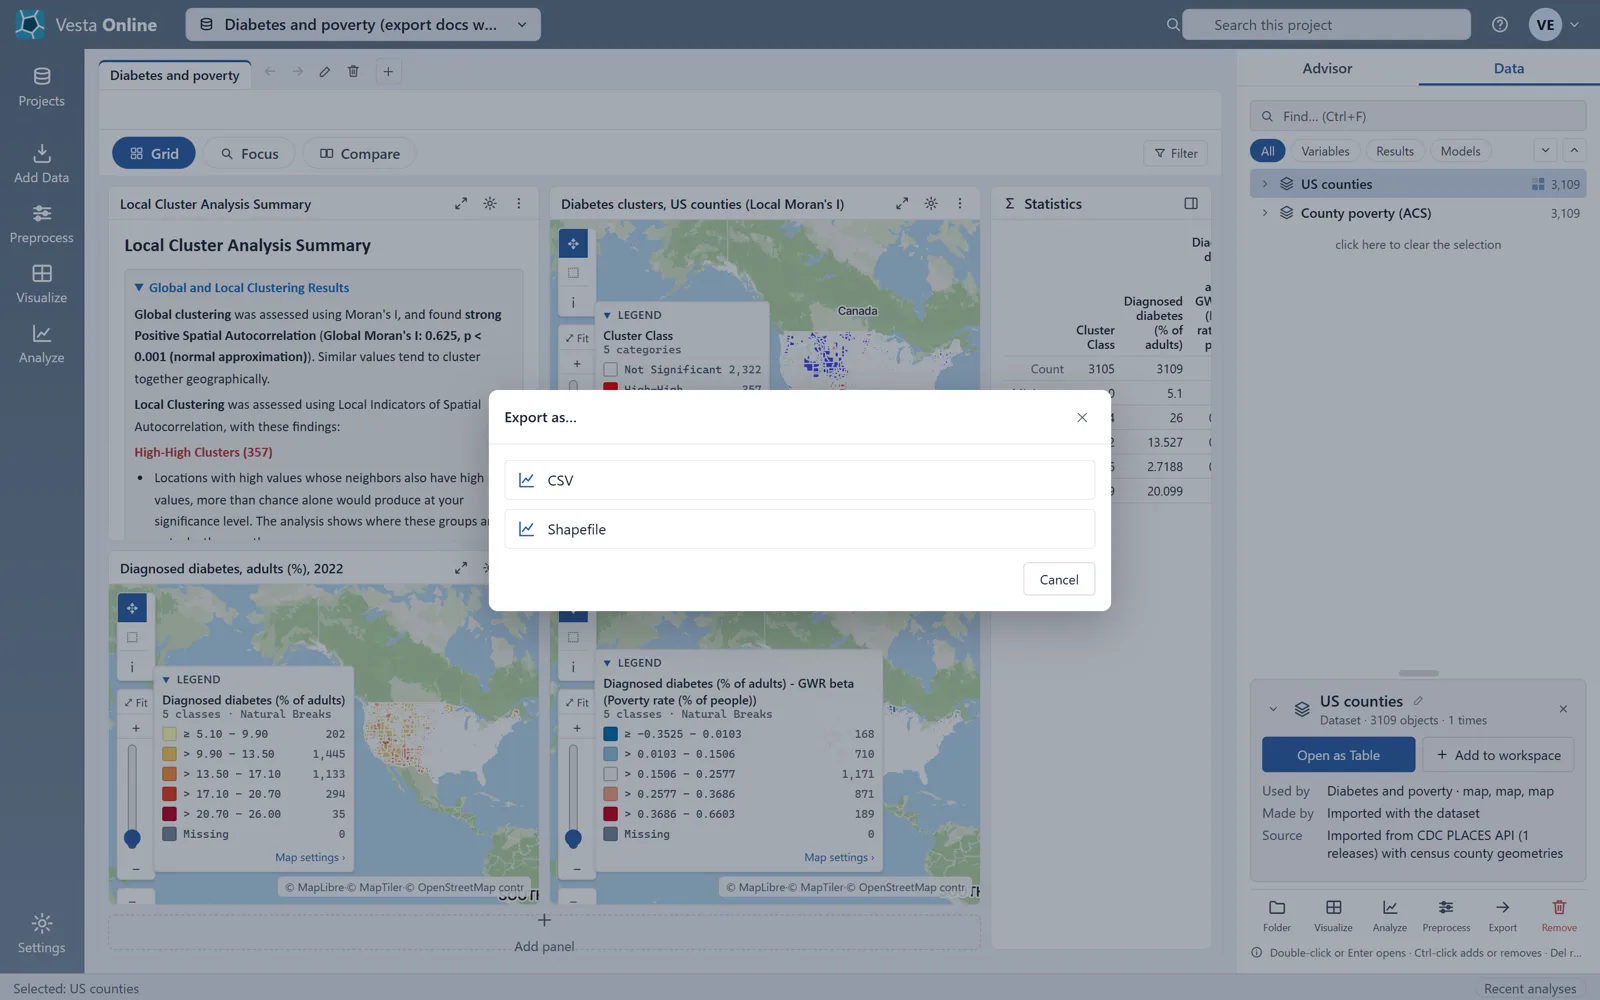
After the CSV
Section titled “After the CSV”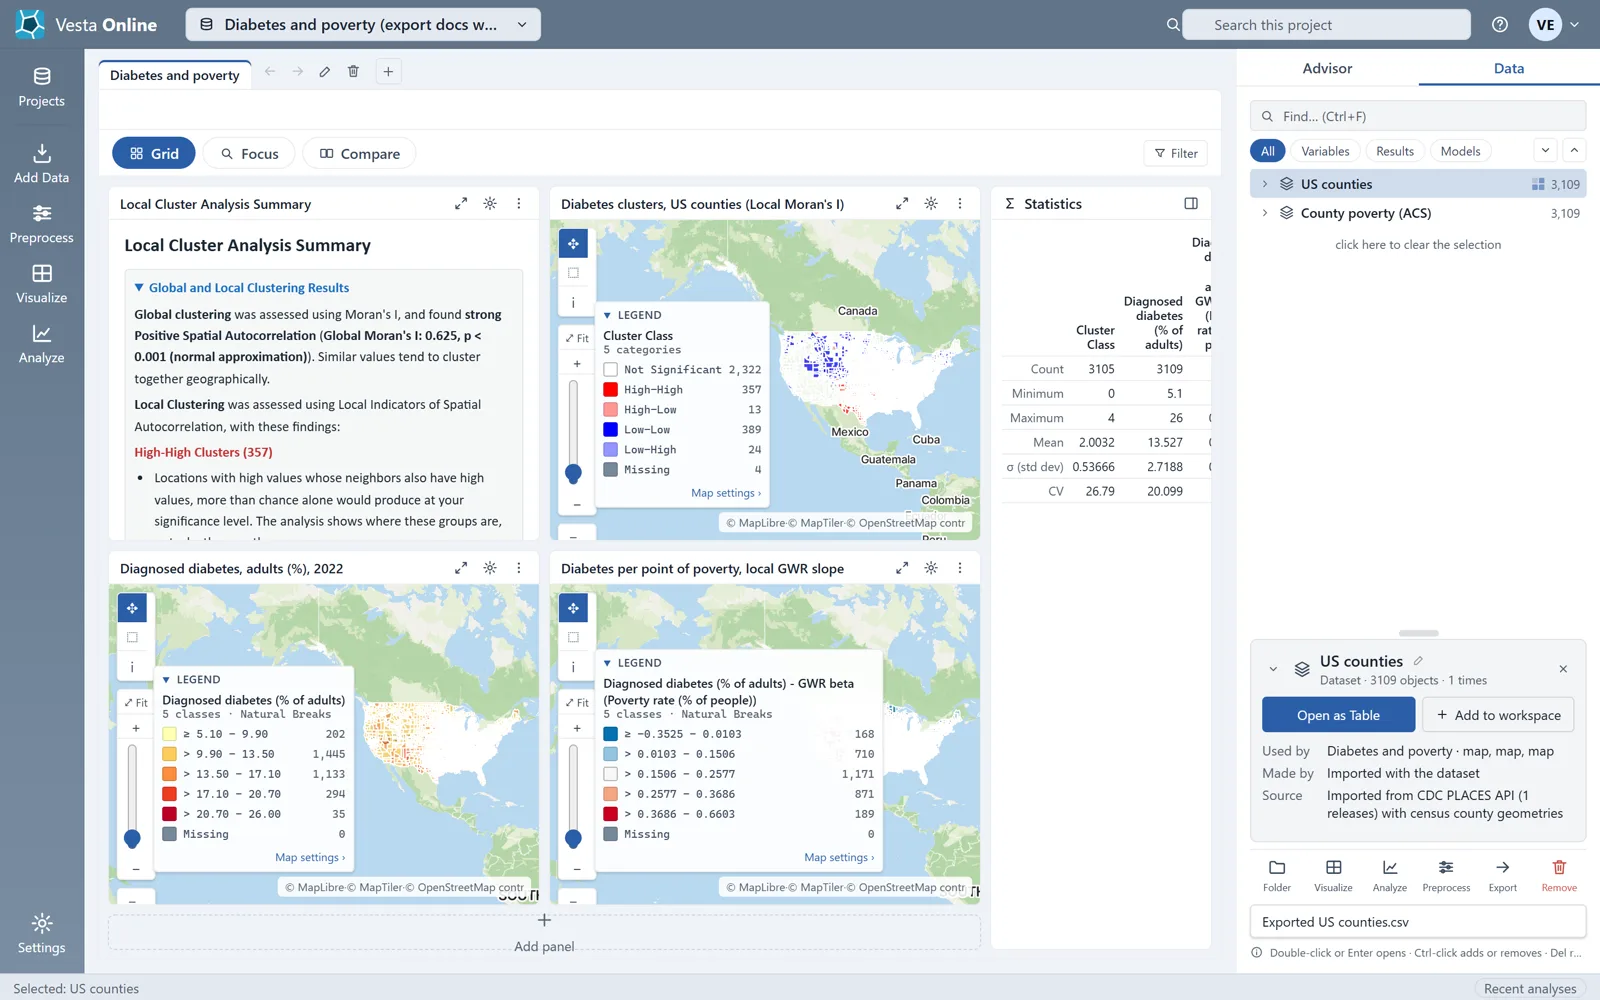
The time question
Section titled “The time question”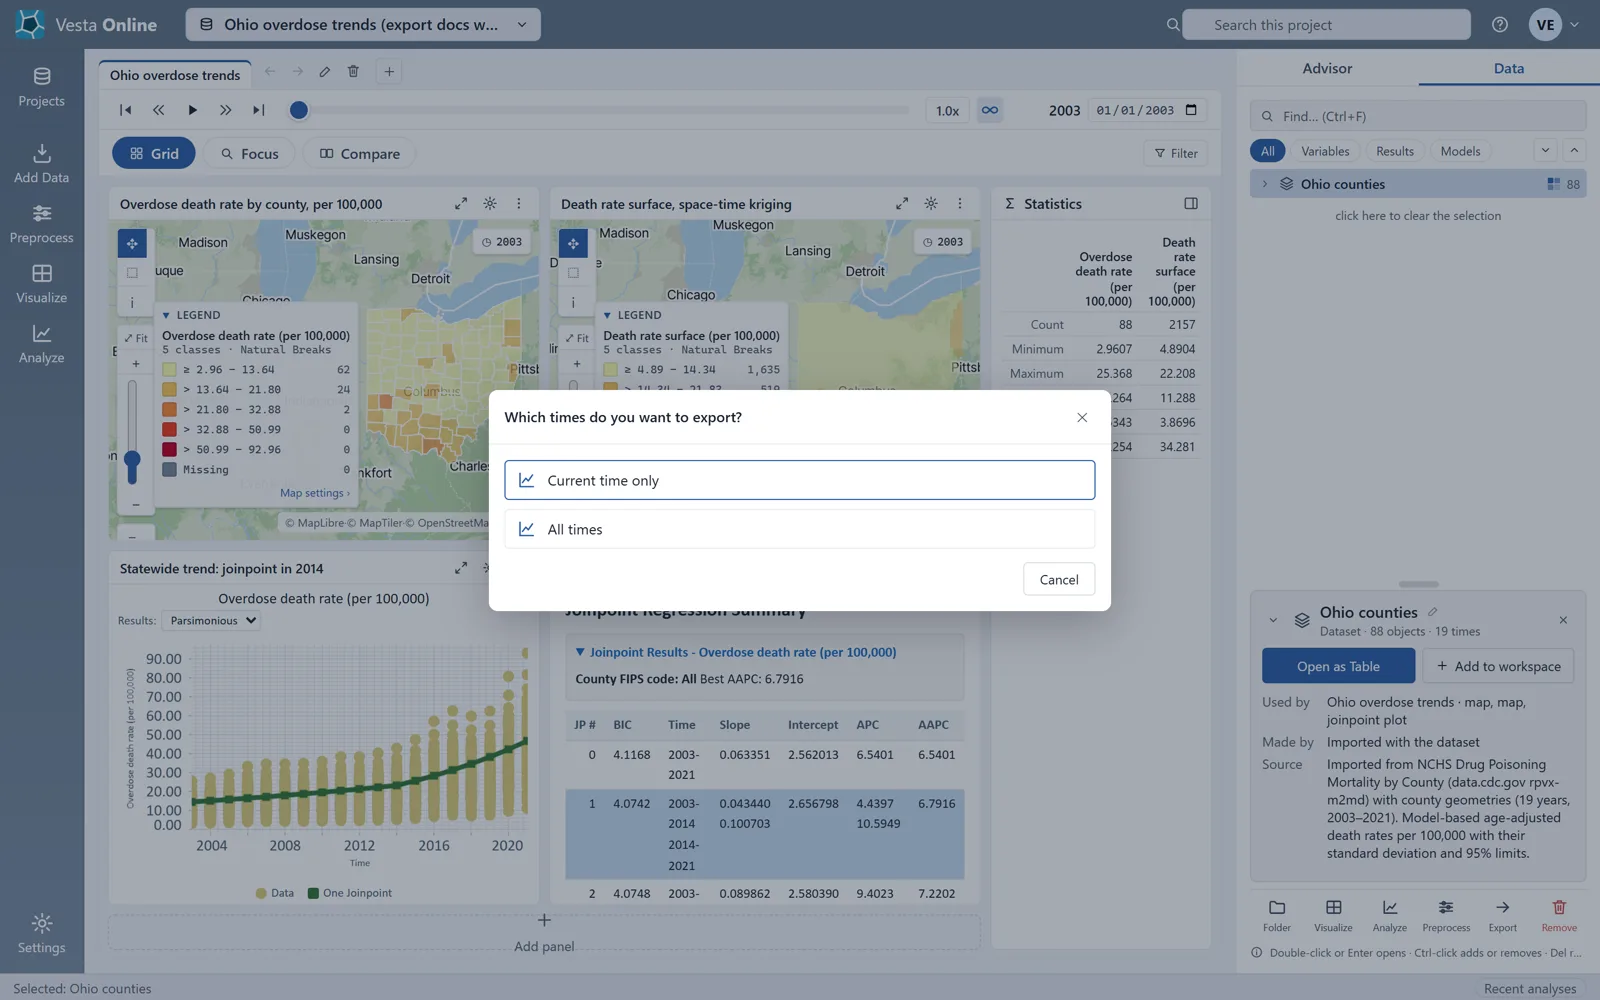
Export a panel
Section titled “Export a panel”- Open a panel's menuEvery panel has a Panel actions button, three dots, in its header. Export is the first item in its menu. On a project you can edit, Rename panel…, Move left, Move right and Remove panel follow it; on a project you can only read, Export is the only item (from Vesta's source; this walk used a project it owned).
- Save a map as an imageChoose Export. The Export visualization box has a File name, which starts as the panel's title, and a Save as type list. Every panel offers PNG image (*.png) and JPEG image (*.jpg). The line under the list shows the file name the browser will save, with the extension of the chosen type.
- Save the fileChoose Save. The browser downloads the picture: Diagnosed diabetes, adults (%), 2022.png. It shows the panel as it looks on screen, with its title bar and legend. From Vesta's source, not measured here: Vesta draws the picture at twice the panel's size on screen, and the JPEG is saved at quality 90.
- Save a table as CSVTo add a table, select a dataset on the Data tab and choose Open as Table. On the table panel choose Export, choose CSV data (*.csv) under Save as type and choose Save. A table's type list has three entries: PNG, JPEG and CSV. Table.csv had the same 19 columns and 3,109 rows as the Data tab export, because a table panel writes its dataset at the current step.
- Open a chartTo get a chart, choose Visualize, then Compare two variables, pick Diagnosed diabetes (% of adults) and Poverty rate (% of people), and choose Create workspace. The workspace has two maps, a scatter plot and a Correlation Matrix.
- Save a chart as CSVOn the Correlation Matrix panel choose Export, choose CSV data (*.csv) and choose Save. The file name starts as the panel's title with the colon replaced by a dash, Correlation Matrix- US counties.csv, and the file was 5,148 bytes. It has a header row of Variable and 15 variable names, then 15 rows of correlations, one per variable.
What you should see in the panel menu
Section titled “What you should see in the panel menu”The panel menu
Section titled “The panel menu”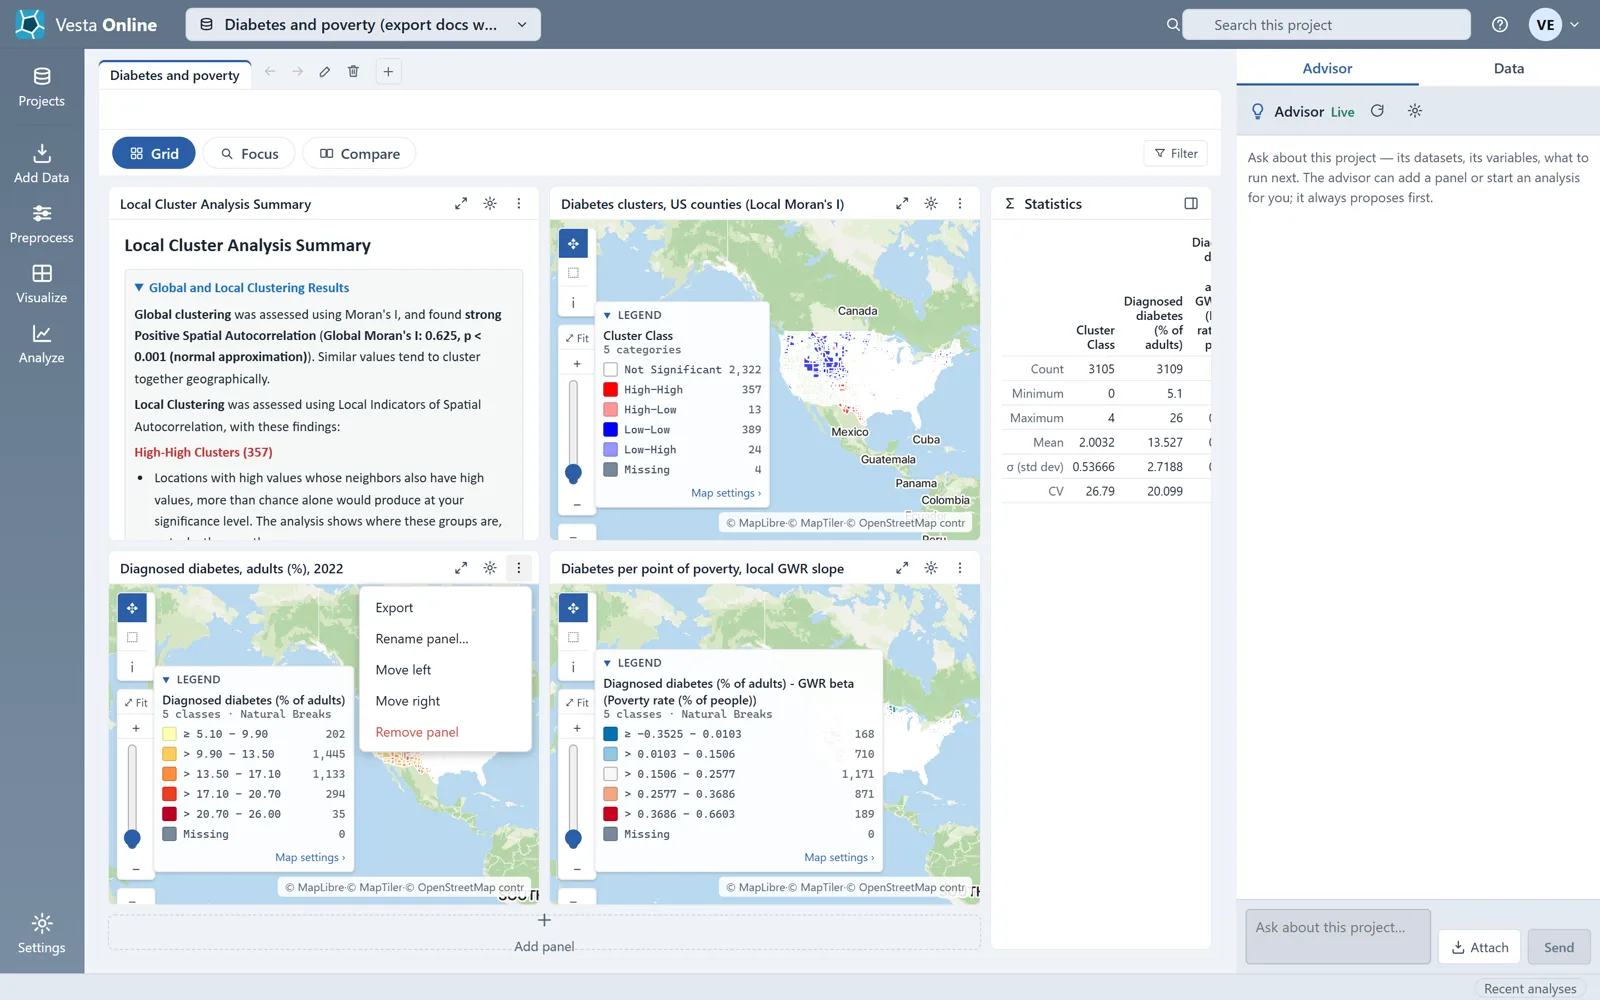
The Export visualization box
Section titled “The Export visualization box”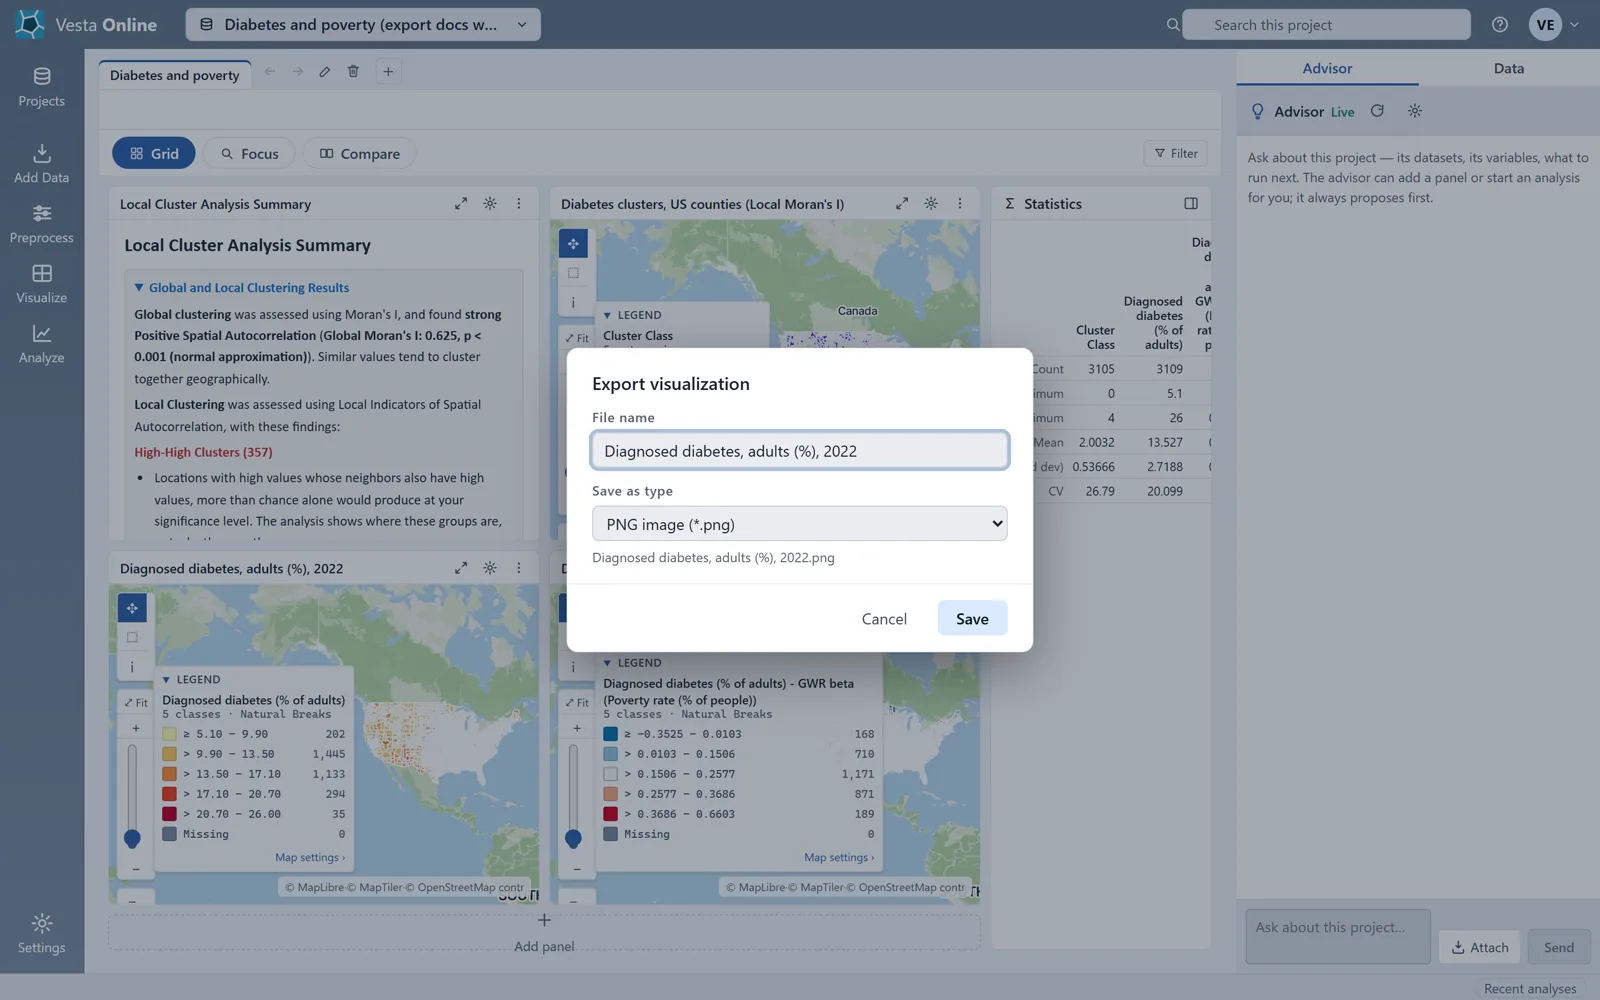
A table’s types
Section titled “A table’s types”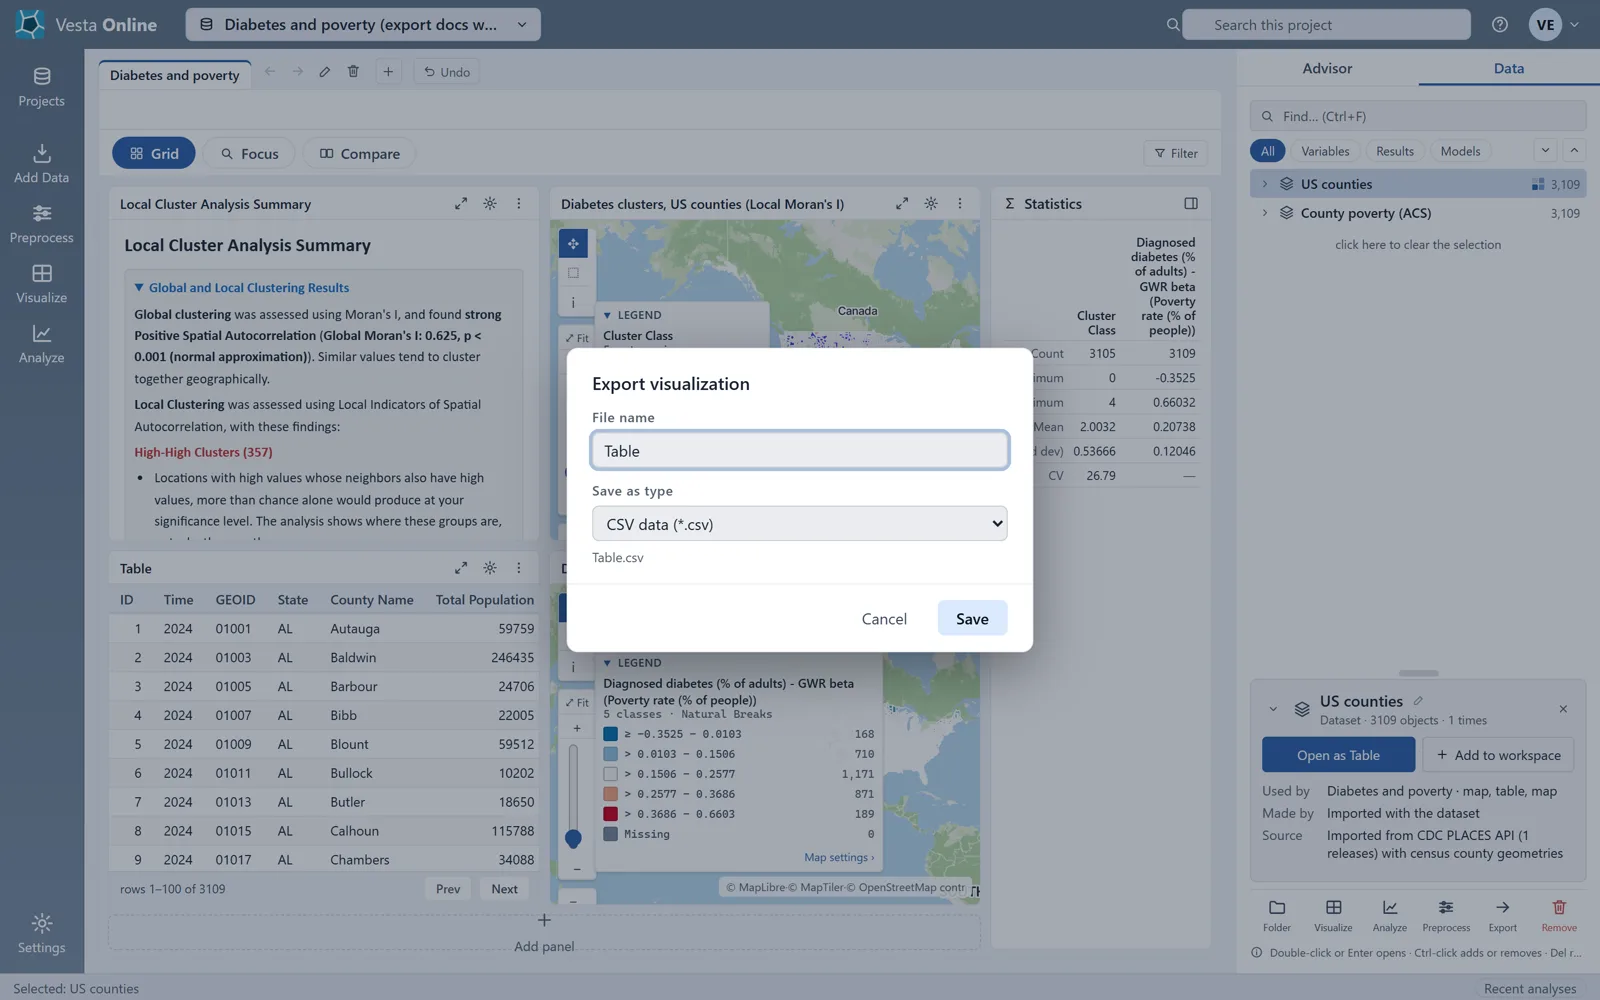
The chart workspace
Section titled “The chart workspace”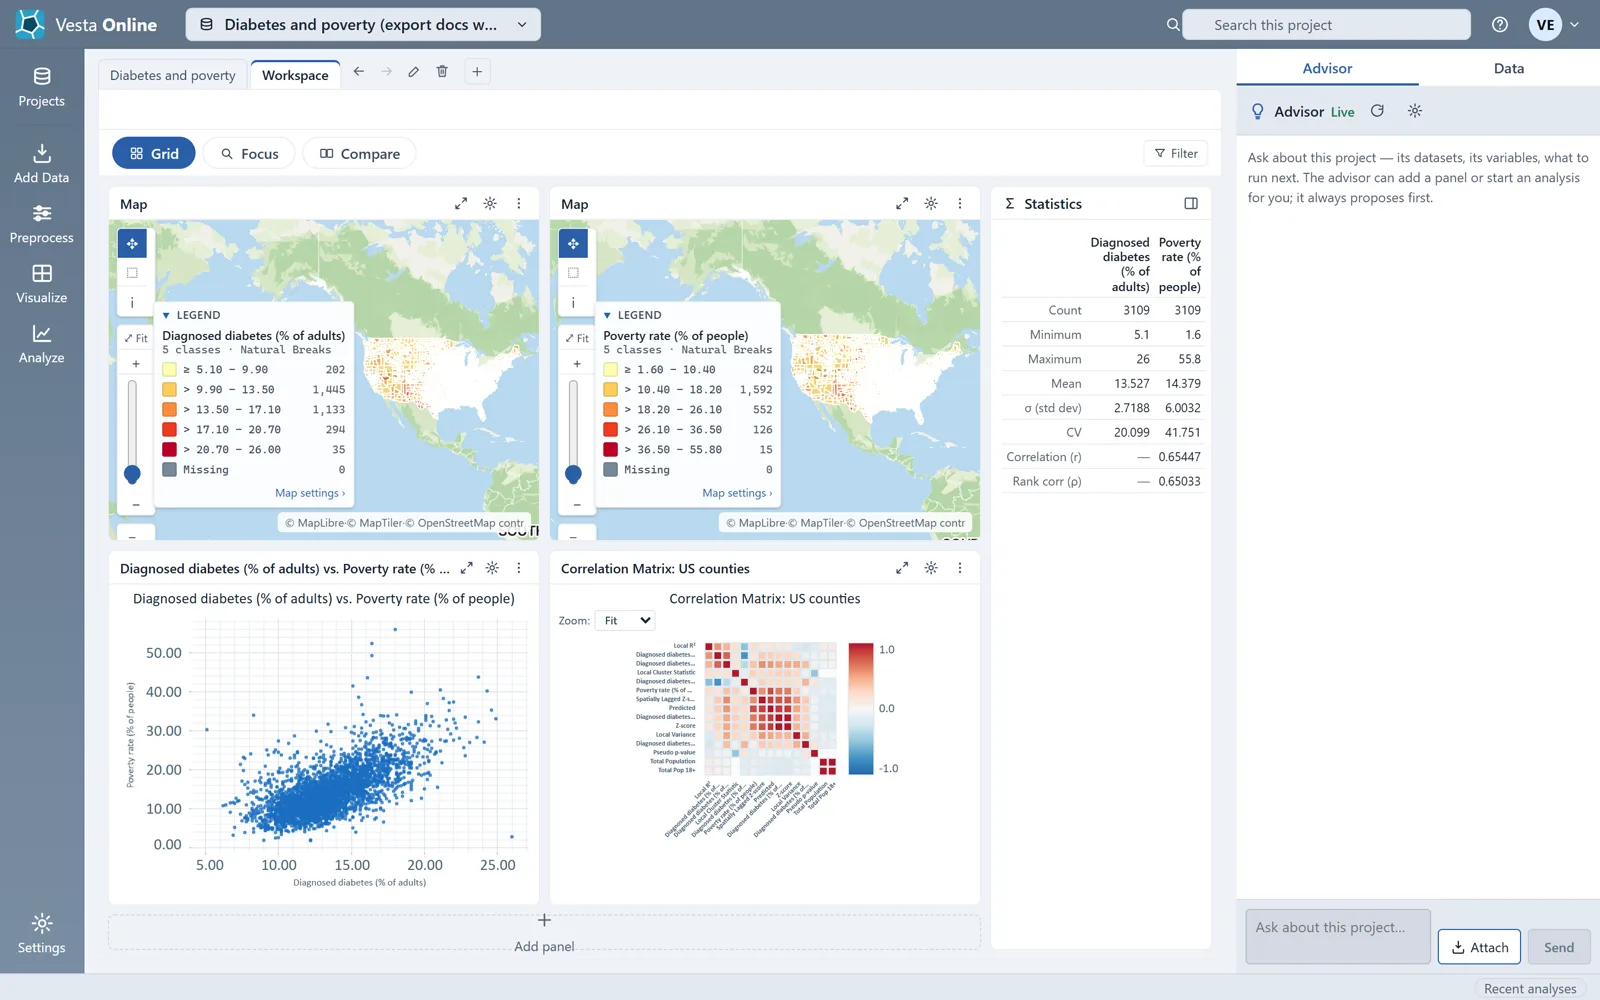
A chart’s types
Section titled “A chart’s types”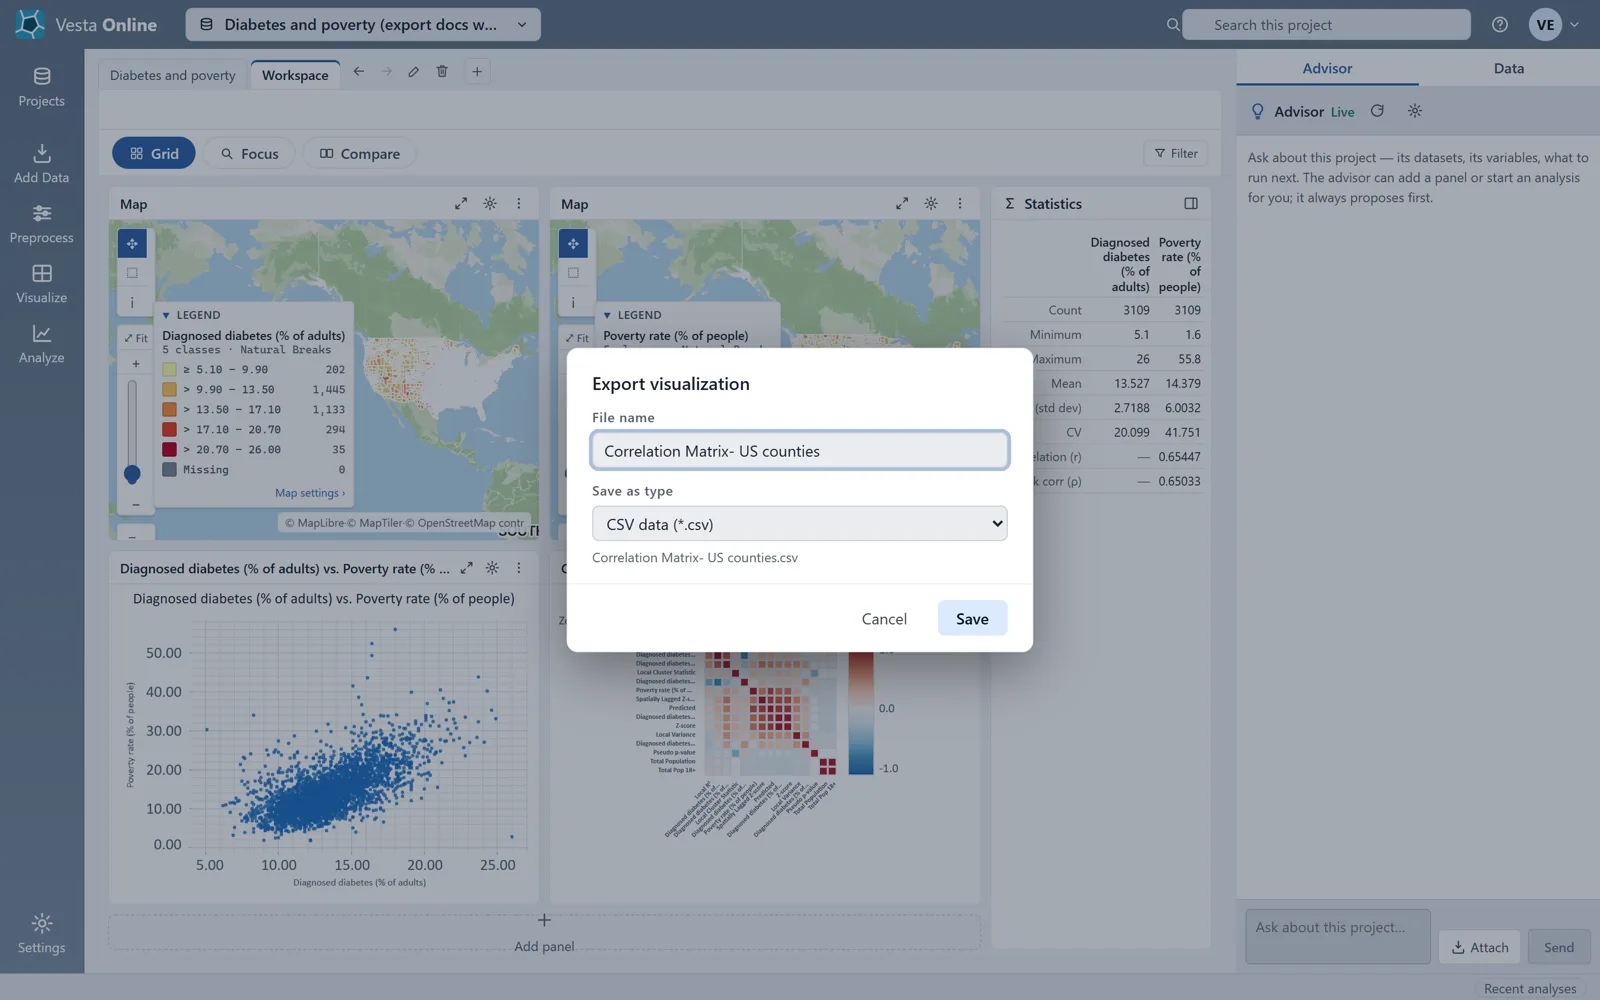
Which files each export writes
Section titled “Which files each export writes”| From | Types | What the file holds |
|---|---|---|
| Data tab, dataset with map shapes | CSV, Shapefile | CSV: a header row and one row per object, or per object and time with All times. Shapefile: a zip of the five files. |
| Data tab, dataset without map shapes | CSV | The same CSV. |
| Data tab, raster dataset | GeoTIFF | The raster. |
| Map panel | PNG, JPEG | A picture of the panel, title bar and legend included. |
| Table panel | PNG, JPEG, CSV | The picture, or the table's dataset at the current step. |
| Chart panel | PNG, JPEG, and CSV for some charts | The picture, or the numbers behind the chart. |
These chart types write the numbers behind them to CSV: correlation matrix, ROC curve, contingency table, rose diagram, correlogram, periodogram, decomposition plot, seasonal subseries, sensitivity heatmap, variable importance, partial dependence and profile plot. That list comes from Vesta’s source, not from a run: only the correlation matrix was walked, and other chart types were not checked for a CSV entry.
Limits
Section titled “Limits”- An export that is too large is refused. The limit is counted in cells, which is objects, times and columns multiplied together, and it is 2,000,000 cells. This comes from Vesta’s source; no export in the walk came near it.
- A cell with no value is written as an empty cell, never as 0.
- This walk-through exported a Shapefile and CSV files from a dataset with map shapes. It did not export a GeoTIFF, a dataset without map shapes, or any chart type other than the correlation matrix, so those lines of the table above come from Vesta’s own definitions, not from a run. The same is true of the read-only project menu, the picture’s twice-size scale and JPEG quality, the 2,000,000-cell limit and the rule that replaces characters a file name cannot hold, apart from the colon the walk showed becoming a dash.
- It did not show the signed-out or link-reader view of the Export entry; that sentence in the introduction also comes from Vesta’s definitions.
- Pictures are made in the browser. If the browser cannot make one, the box shows The image could not be created in this browser.
Where next
Section titled “Where next”- Make the maps you export: Maps.
- Make the charts you export: Charts.
- Share a project instead of a file: Sharing projects.
- Bring data in: Importing data.