Data Library
The public data sources built into Vesta Online: the six categories, what each source covers, and how to pick one source, its geography and its measures.
The Data Library is the name this site uses for the public data sources built into Vesta Online. In the app there is no screen of that name: you reach it from Add Data in the left rail, under From an online source. Every step below was run on Vesta Online, and the screenshots come from that run.
The catalog this walk saw lists 28 sources in six categories. One of them, EMPRES-i, is restricted (see below), so 27 are open to every account. The ACS tables count as three sources. Each category card says how many it holds: US Public Health 6, US Demographics 5, World Demographics 4, Agriculture & Livestock 5, Geography & Climate 7 and Just for Fun 1.
Browse and pick a source
Section titled “Browse and pick a source”- Open Add DataOpen a project and choose Add Data in the left rail, then From an online source. The Source step shows six category cards, each with a one-line description and how many datasets it holds.
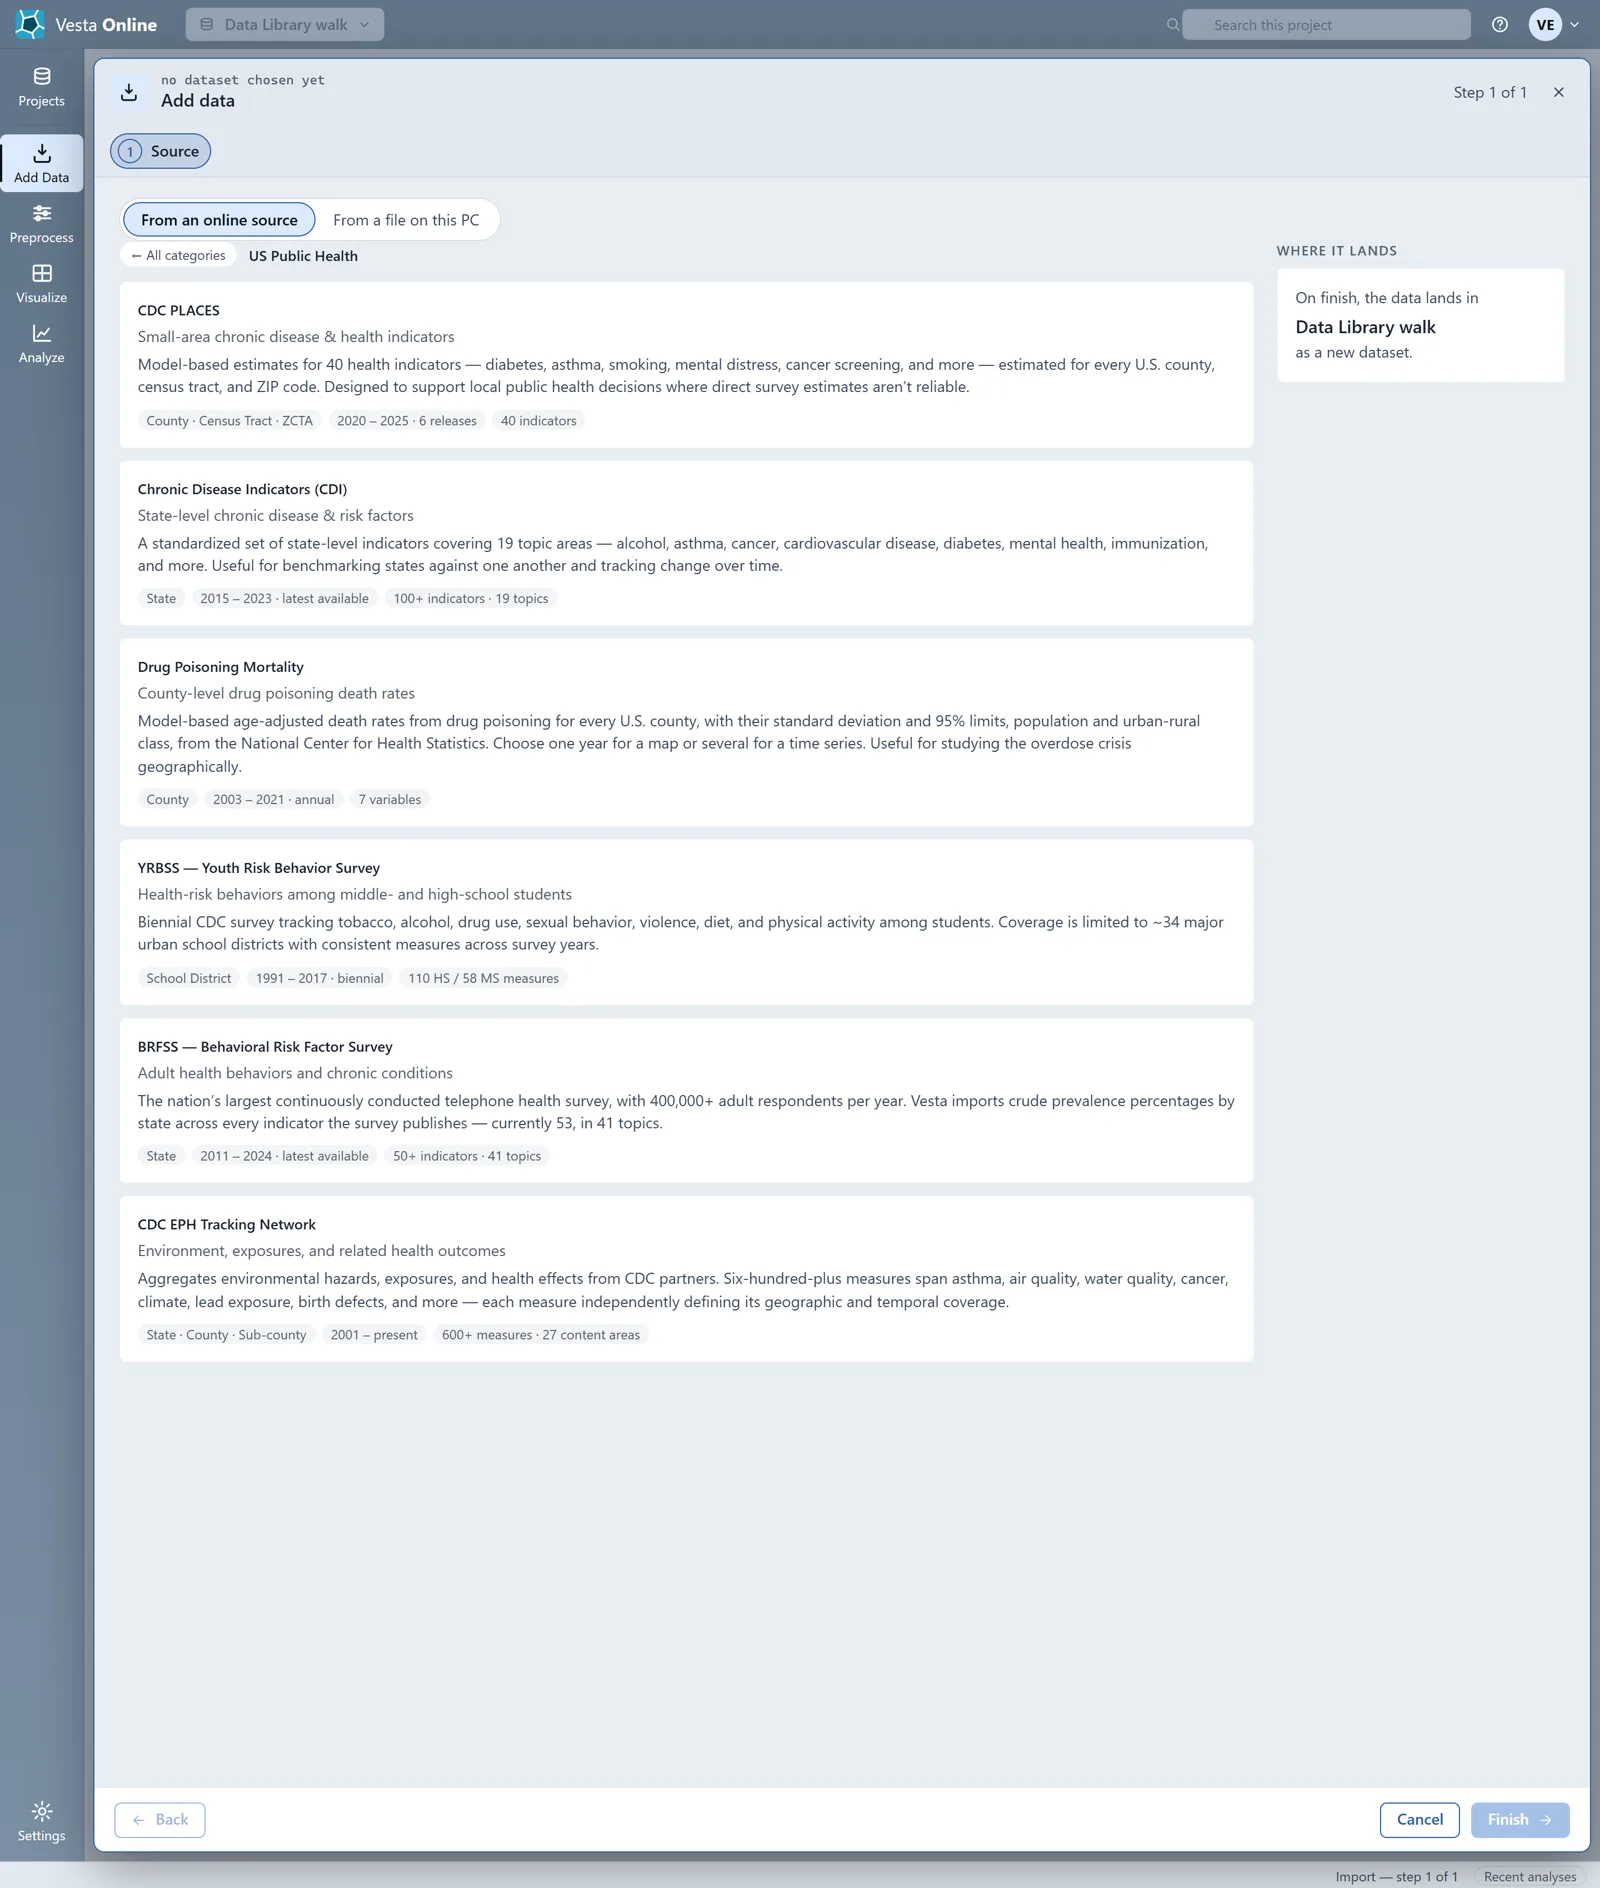
- Browse a categoryChoose a category card. Its sources list as cards with a name, a tagline, a description and chips for geography, years and size. Choose All categories to go back. Repeat for each category.
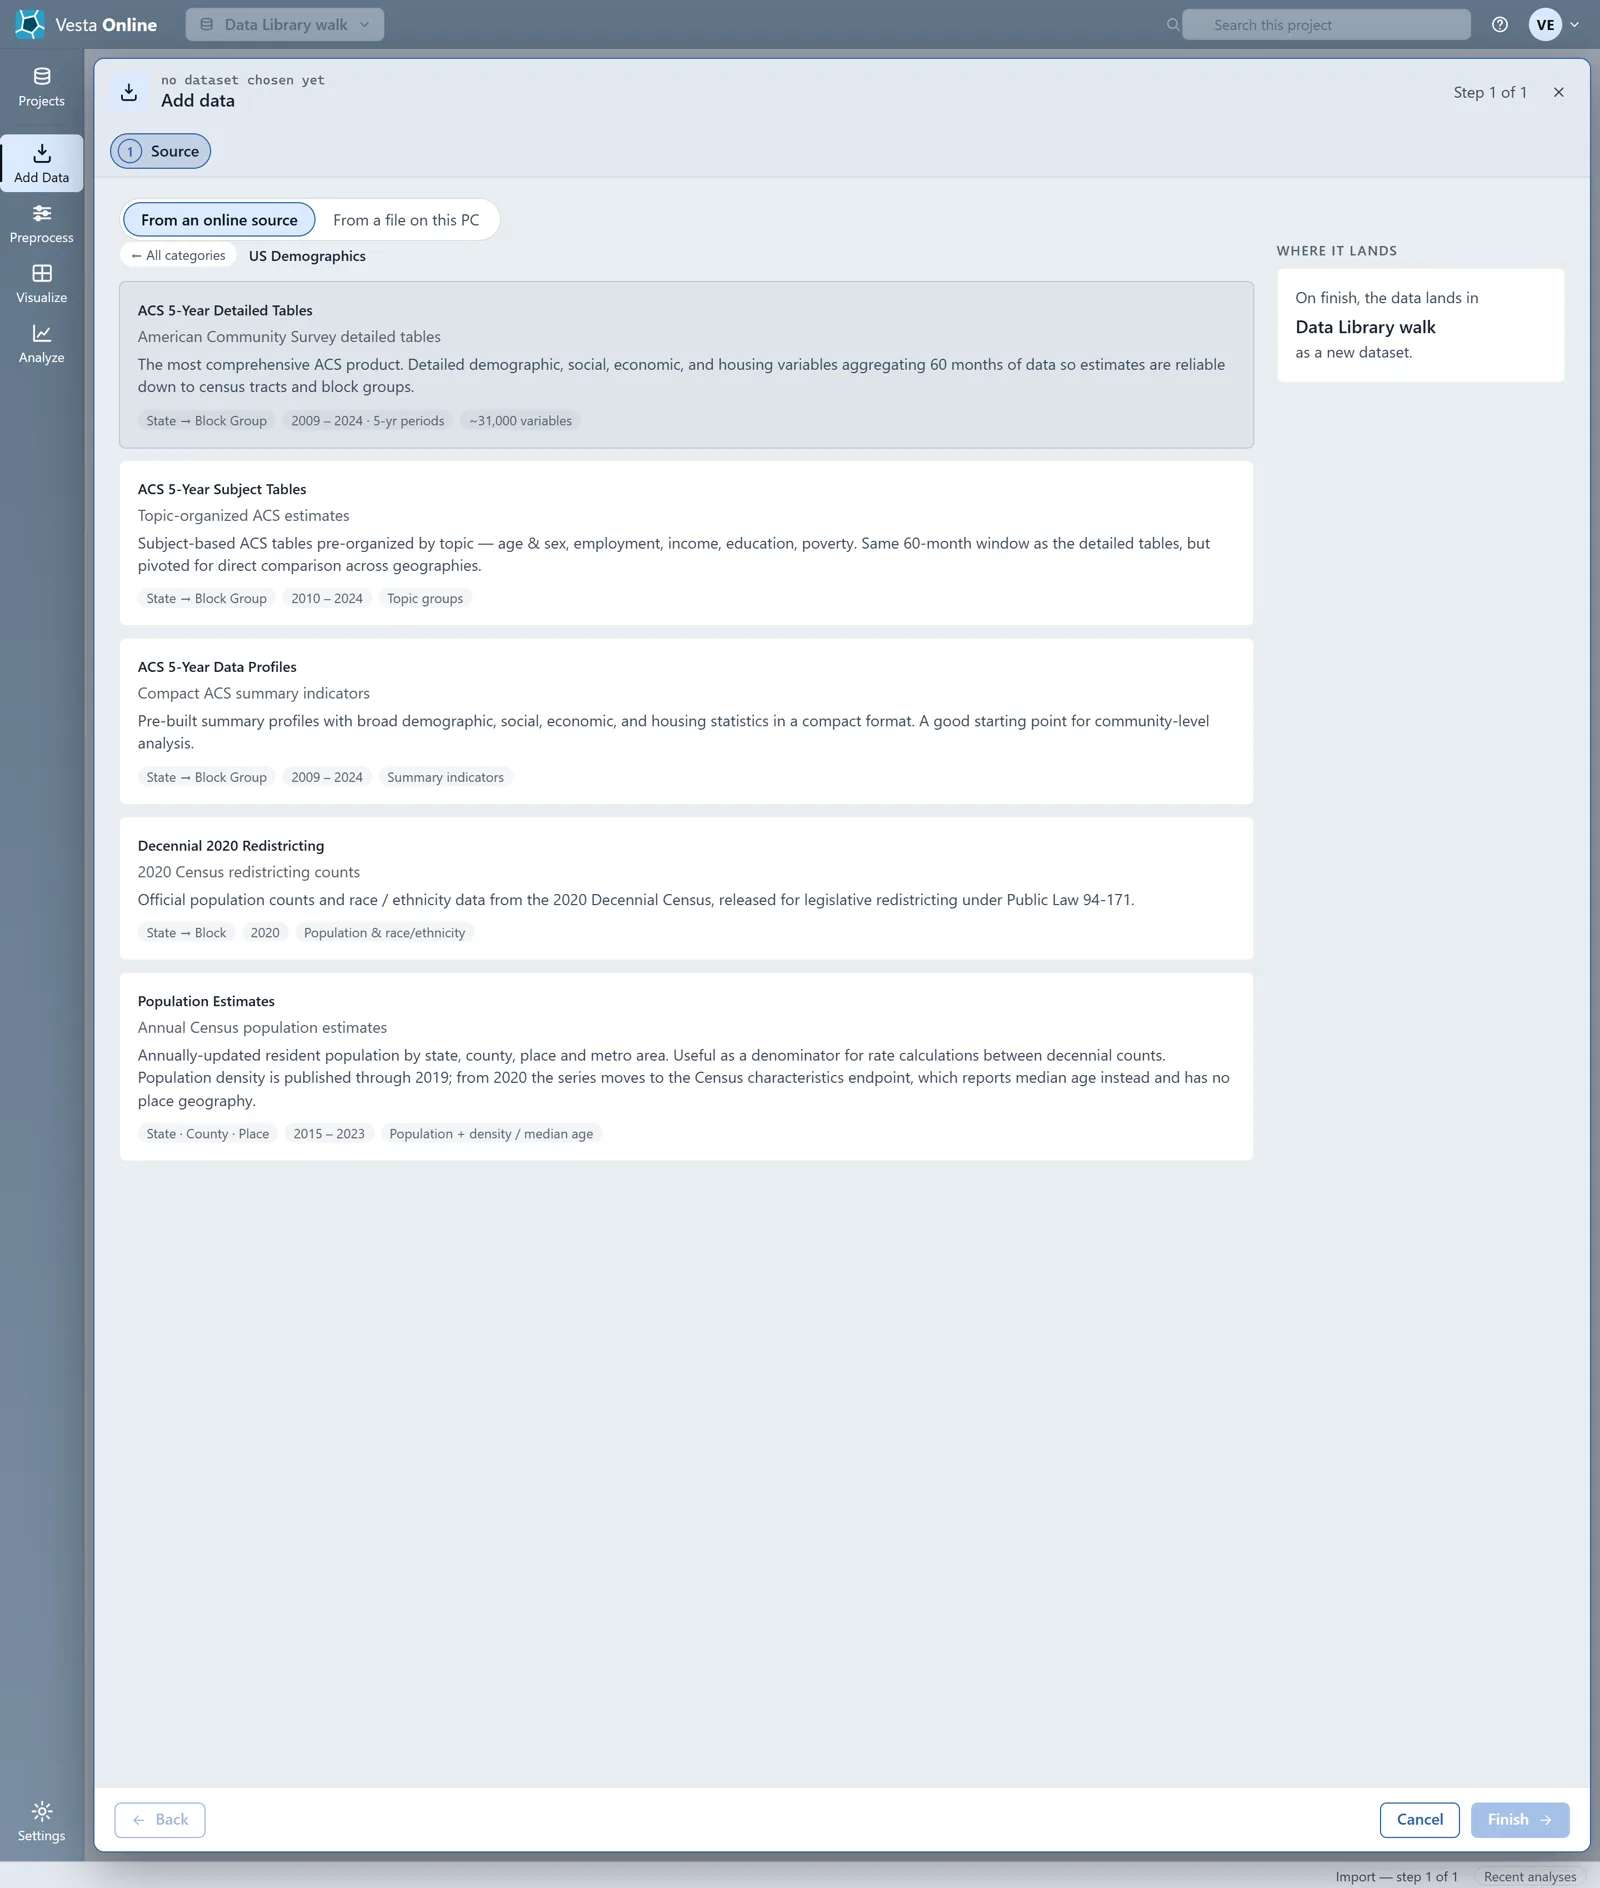
- Pick a source and its yearsChoose a source card, here ACS 5-Year Detailed Tables under US Demographics, then Next: Years. The Years list runs 2009 to 2024 with the newest year already selected; pick one year for a plain dataset or several for a value per year. This walk adds 2023.
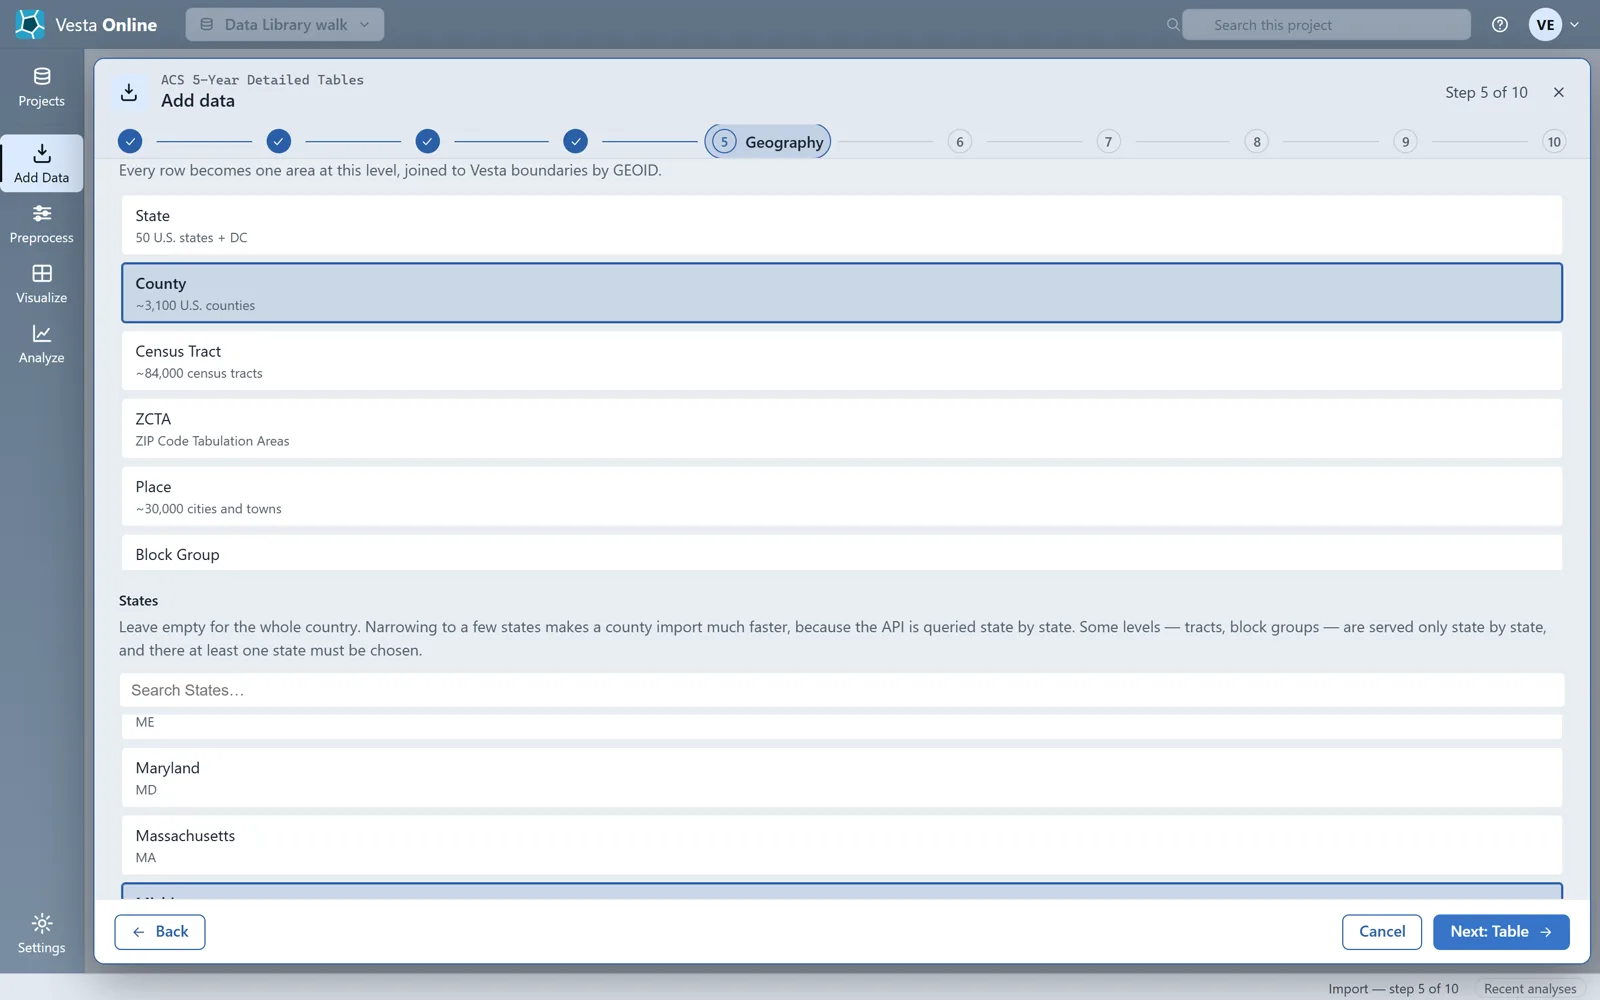
- Choose the geographyChoose Next: Geography. Pick a Geographic level (this walk uses County); Until you do, Next stays disabled and the footer says Pick a value for “Geographic level” to continue. Under States, leave the list empty for the whole country or pick states (here Michigan).
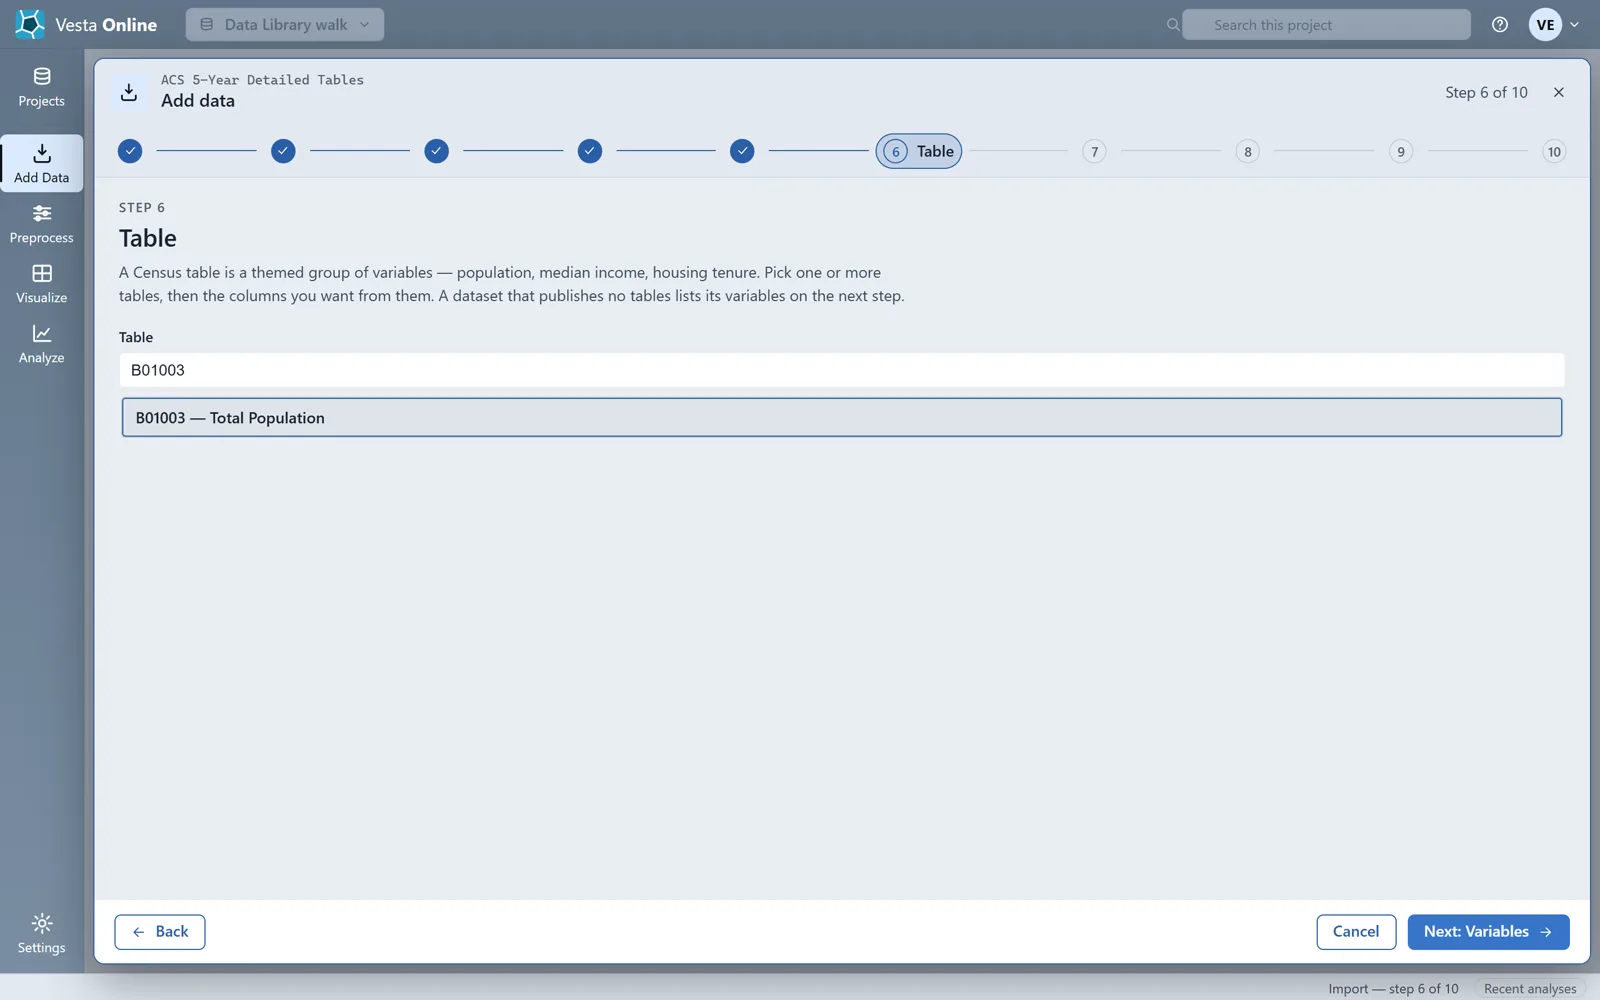
- Choose a tableChoose Next: Table. The Table list holds every ACS detailed table, so type in Search Table and pick one (here B01003, Total Population).
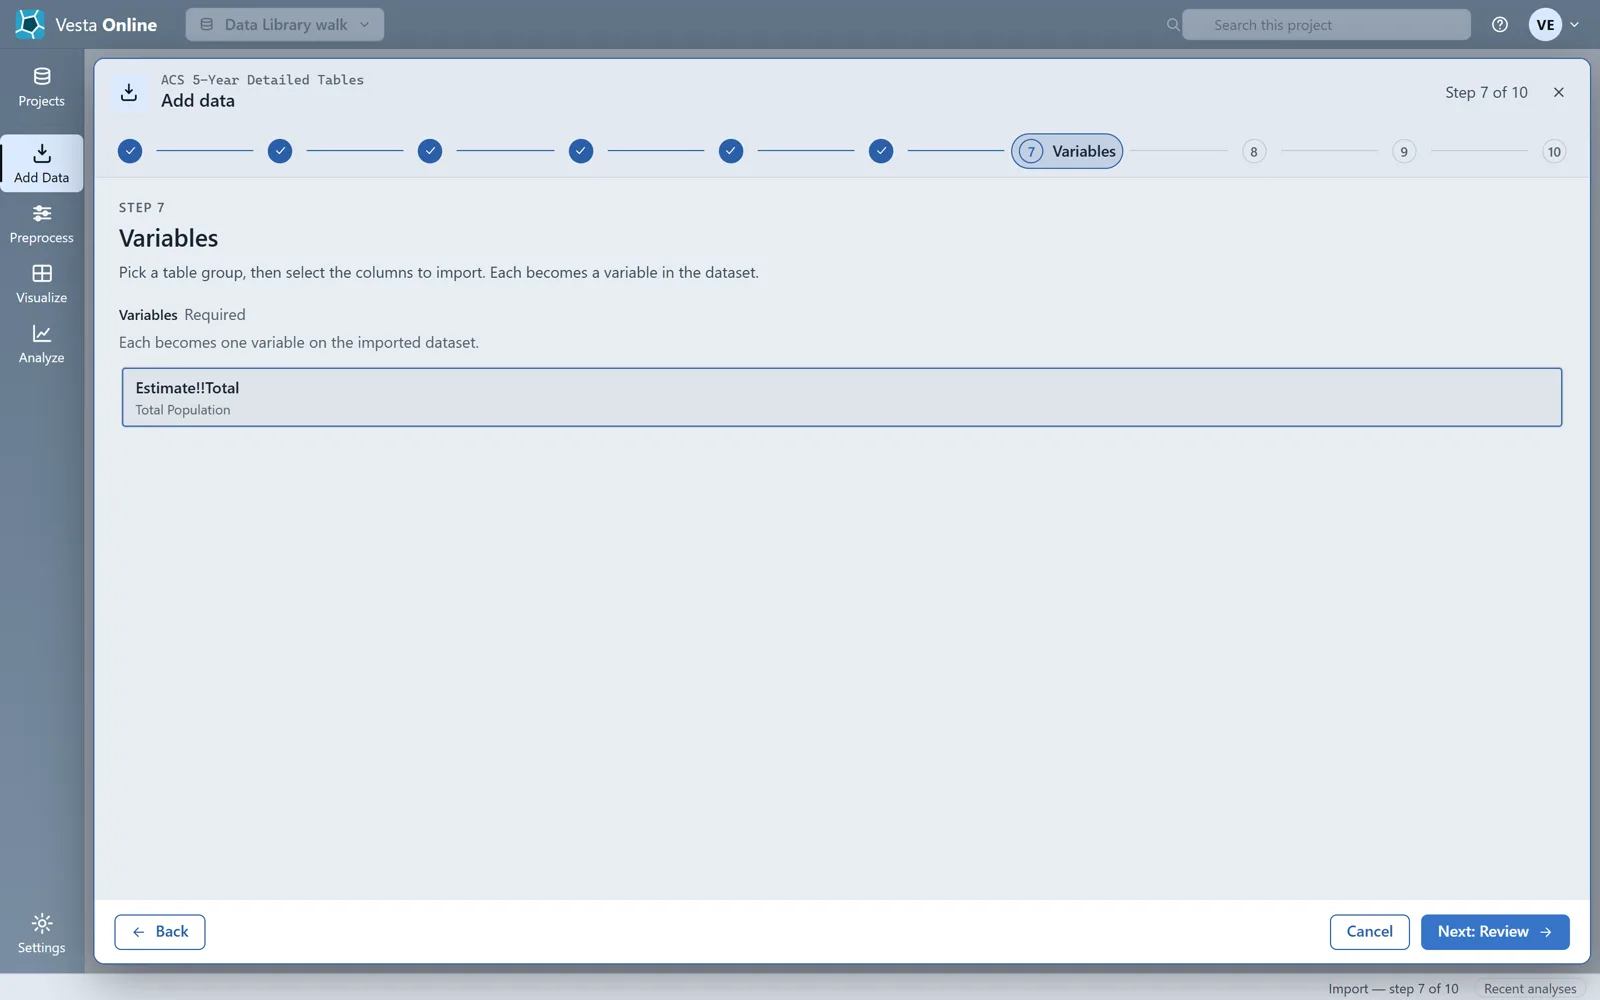
- Choose the variableChoose Next: Variables. Variables lists the columns of the table you picked; each one you select becomes one variable on the imported dataset. Select Estimate!!Total.
- Review before anything runsChoose Next: Review. Review lists every choice with an Edit button, a Dataset name you can change and a note that nothing has been imported yet. The walk stops here; the import itself is in Importing data.
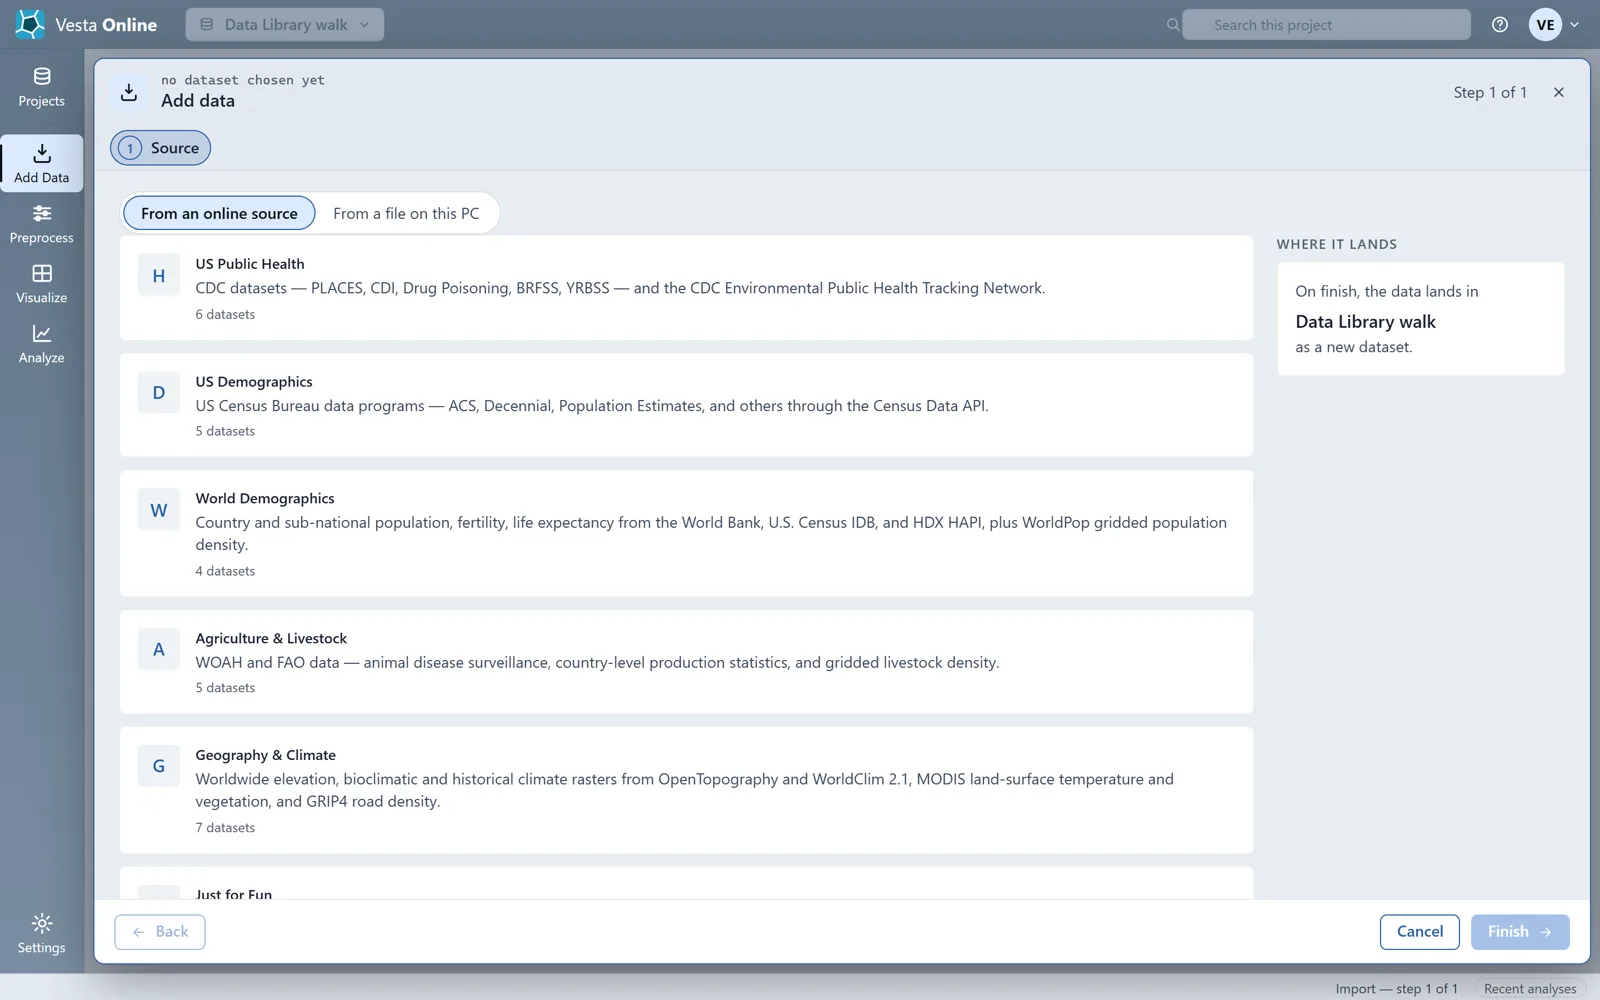
The sources, by category
Section titled “The sources, by category”The tables below are what the catalog cards show, except for the restricted EMPRES-i card, which has its own note. Choose a source card to see its own steps: they differ by source. Year ranges are as the cards state them; the ACS 5-Year Detailed Tables card and its Years step both read 2009 to 2024. Check the Years step of the source you want.
US Public Health
Section titled “US Public Health”| Source | Publisher | Geography | Years |
|---|---|---|---|
| CDC PLACES | CDC | County, Census Tract, ZCTA | 2020 to 2025 (6 releases) |
| Chronic Disease Indicators (CDI) | CDC | State | 2015 to 2023, latest available |
| Drug Poisoning Mortality | National Center for Health Statistics | County | 2003 to 2021 |
| YRBSS (Youth Risk Behavior Survey) | CDC | School district (about 34 major urban districts) | 1991 to 2017, biennial |
| BRFSS (Behavioral Risk Factor Survey) | CDC | State | 2011 to 2024, latest available |
| CDC EPH Tracking Network | CDC and partners | State, County, Sub-county | 2001 to present |
US Demographics
Section titled “US Demographics”| Source | Publisher | Geography | Years |
|---|---|---|---|
| ACS 5-Year Detailed Tables | U.S. Census Bureau | State to Block Group | 2009 to 2024, 5-year periods |
| ACS 5-Year Subject Tables | U.S. Census Bureau | State to Block Group | 2010 to 2024 |
| ACS 5-Year Data Profiles | U.S. Census Bureau | State to Block Group | 2009 to 2024 |
| Decennial 2020 Redistricting | U.S. Census Bureau | State to Block | 2020 |
| Population Estimates | U.S. Census Bureau | State, County, Place | 2015 to 2023 |
Population Estimates publishes population density through 2019; from 2020 the series reports median age instead and has no place geography.
World Demographics
Section titled “World Demographics”| Source | Publisher | Geography | Years |
|---|---|---|---|
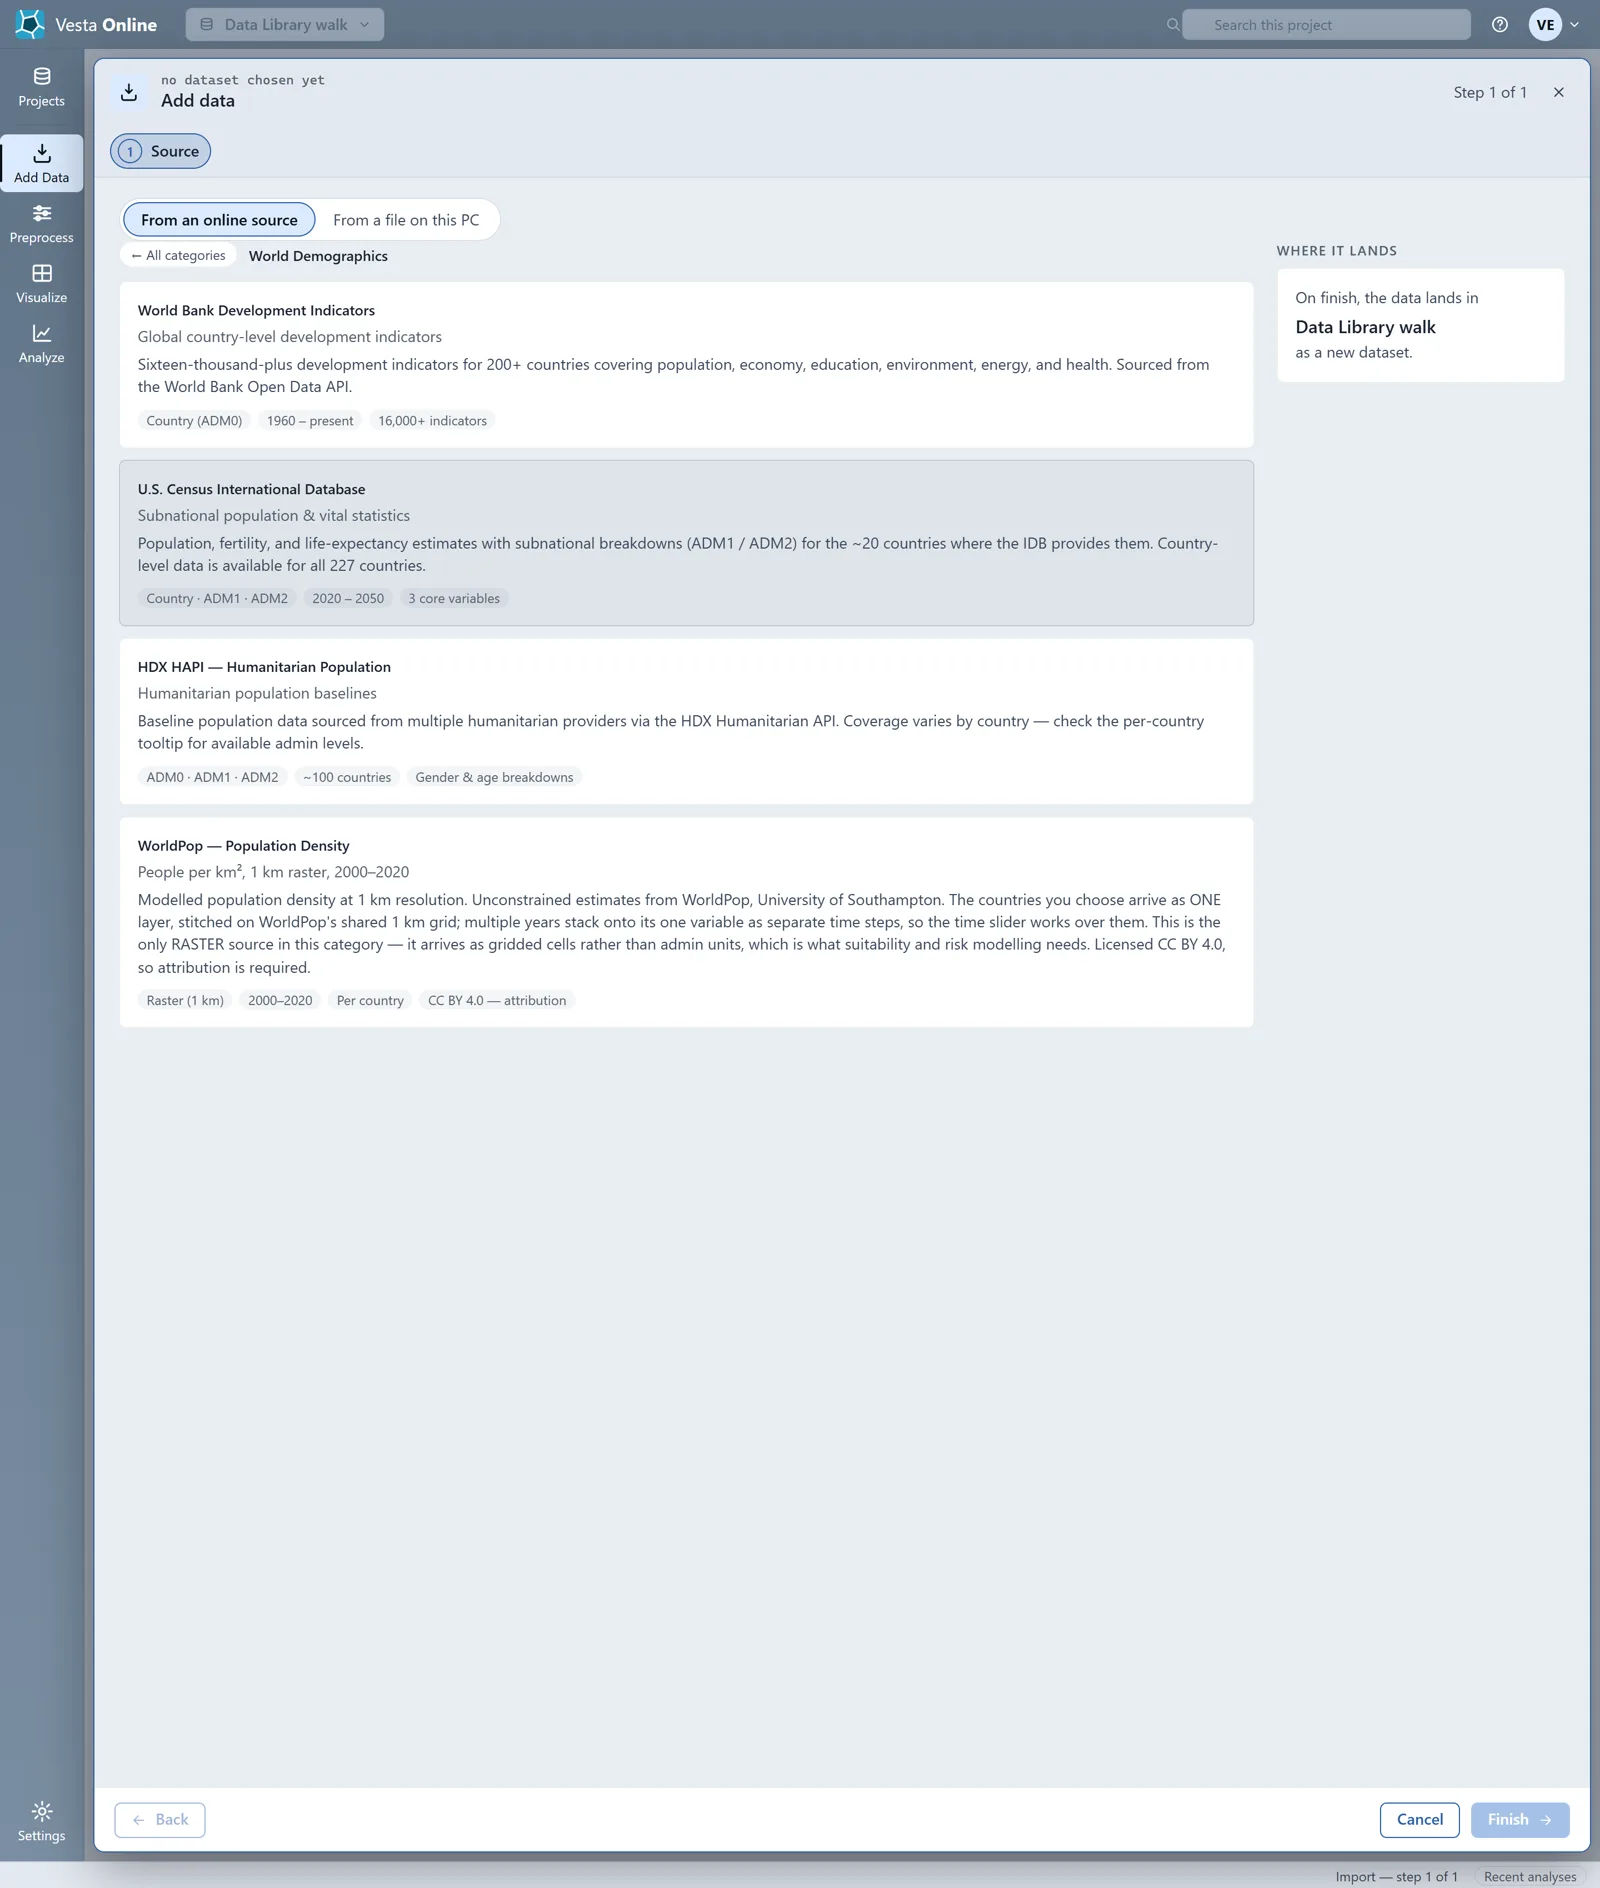
| World Bank Development Indicators | World Bank | Country (ADM0) | 1960 to present |
| U.S. Census International Database | U.S. Census Bureau | Country, ADM1, ADM2 | 2020 to 2050 |
| HDX HAPI (Humanitarian Population) | Humanitarian Data Exchange providers | ADM0, ADM1, ADM2 | About 100 countries; no year range on the card |
| WorldPop Population Density | WorldPop, University of Southampton | Raster, 1 km | 2000 to 2020 |
WorldPop is licensed CC BY 4.0, so attribution is required. Of the four sources it is the only one that arrives as a raster (gridded cells) rather than admin units.
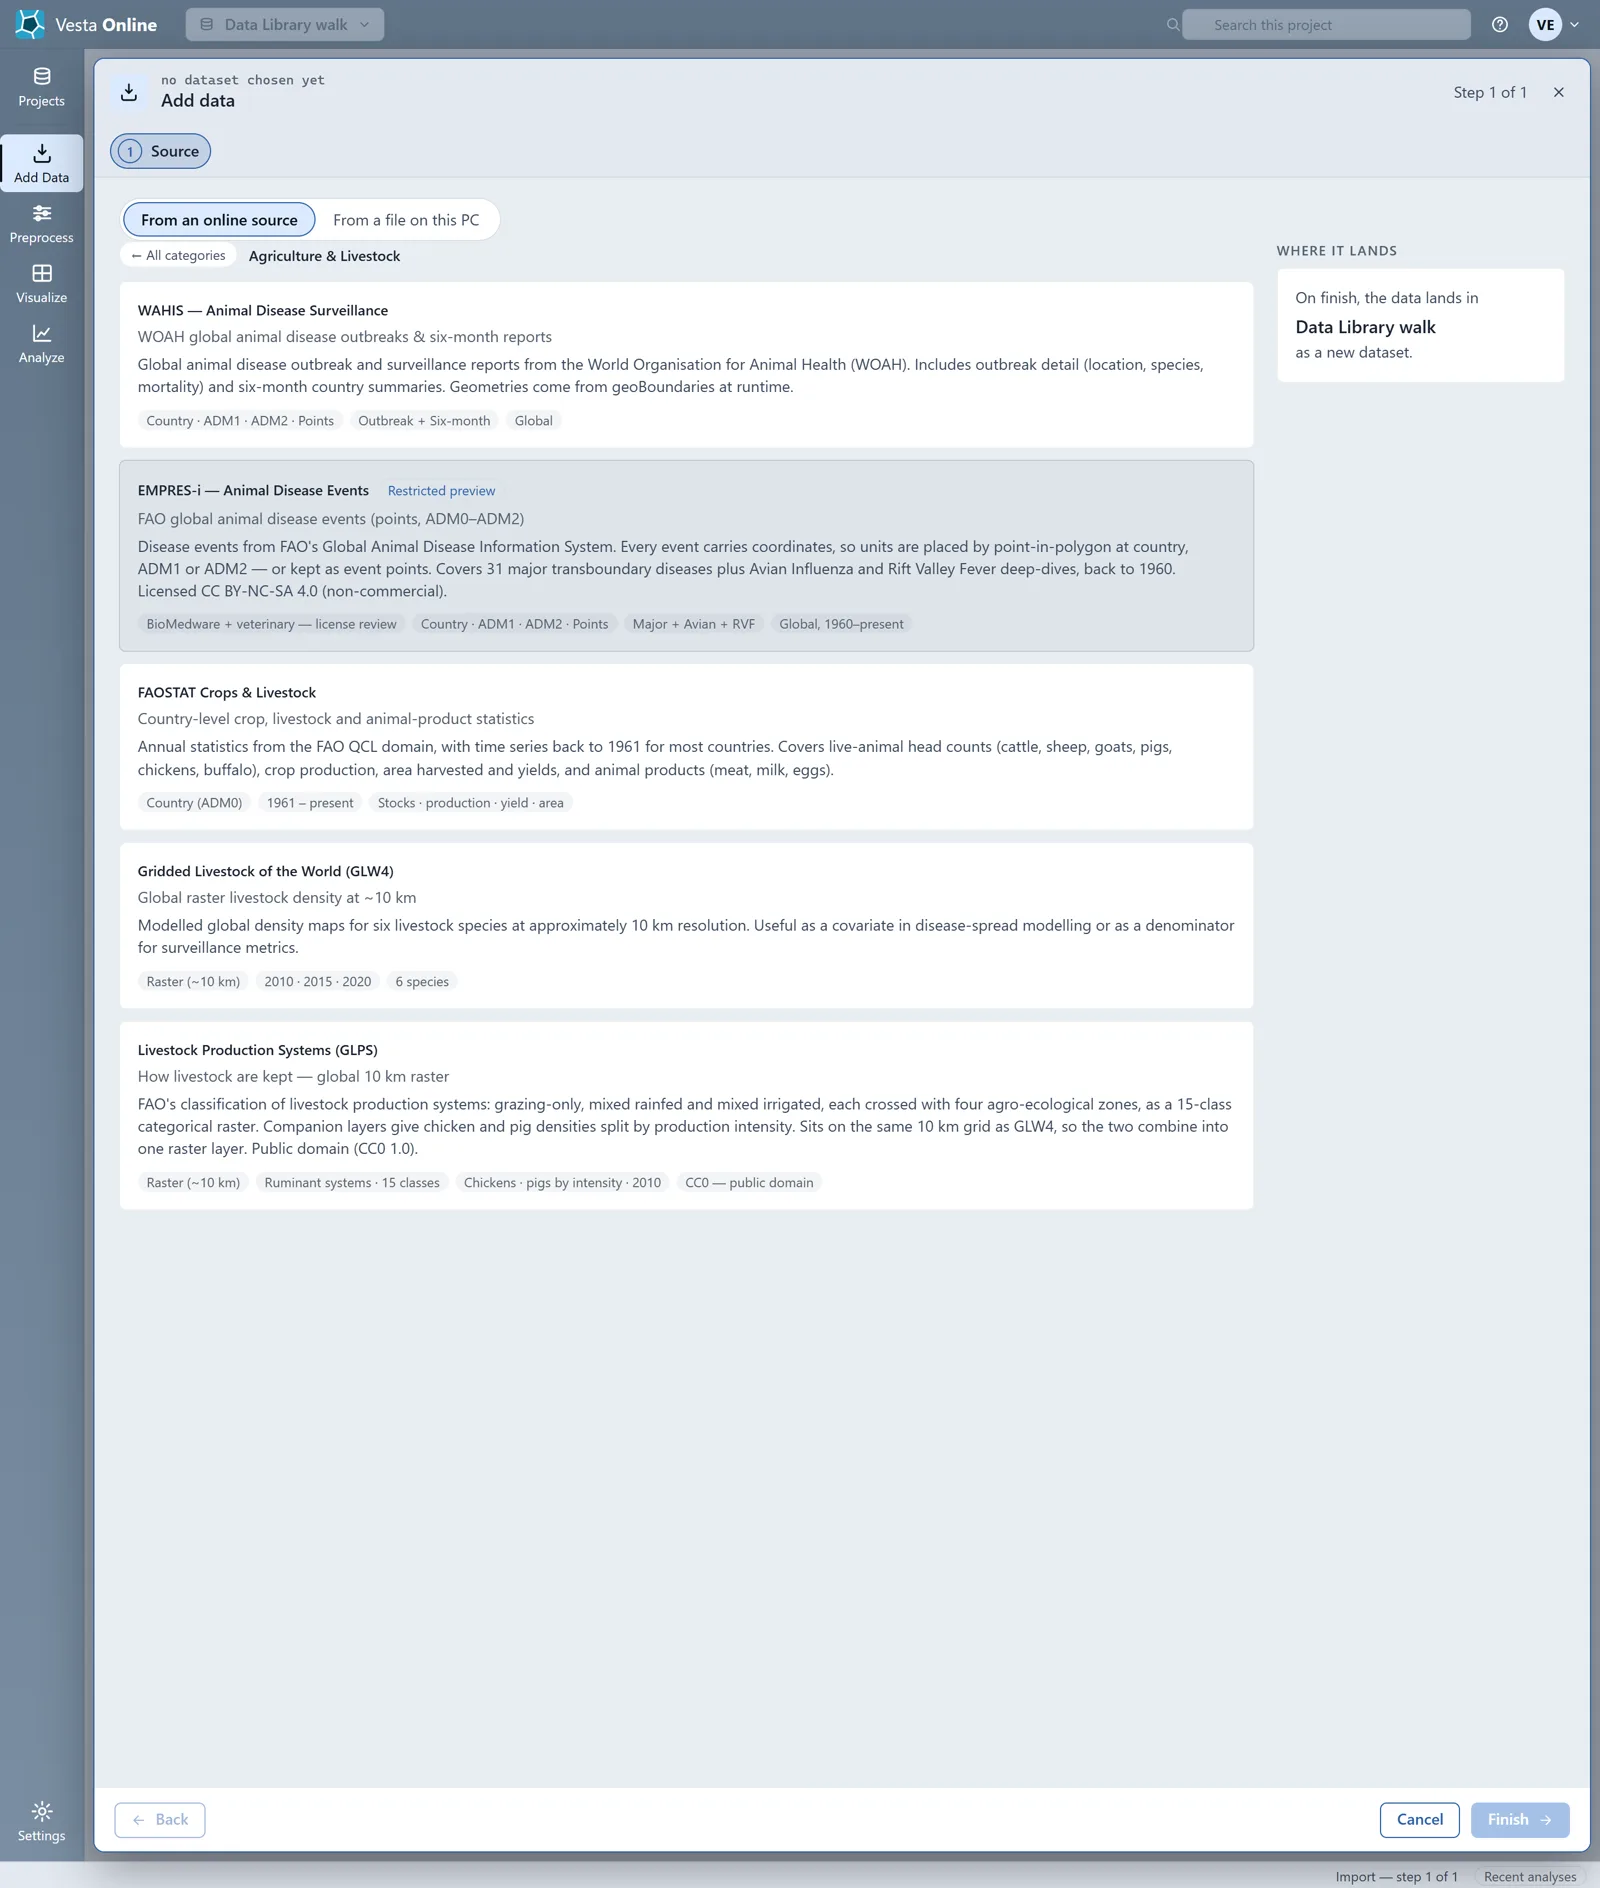
Agriculture and Livestock
Section titled “Agriculture and Livestock”The walk’s account sees five cards here; the table has the four open to every account.
| Source | Publisher | Geography | Years |
|---|---|---|---|
| WAHIS (Animal Disease Surveillance) | World Organisation for Animal Health | Country, ADM1, ADM2, Points | Global; no year range on the card (chips read Outbreak + Six-month) |
| FAOSTAT Crops and Livestock | FAO | Country (ADM0) | 1961 to present |
| Gridded Livestock of the World (GLW4) | Not named on the card | Raster, about 10 km | 2010, 2015, 2020 |
| Livestock Production Systems (GLPS) | FAO | Raster, about 10 km | No year range on the card; one chip reads Chickens · pigs by intensity · 2010 |
Geography and Climate
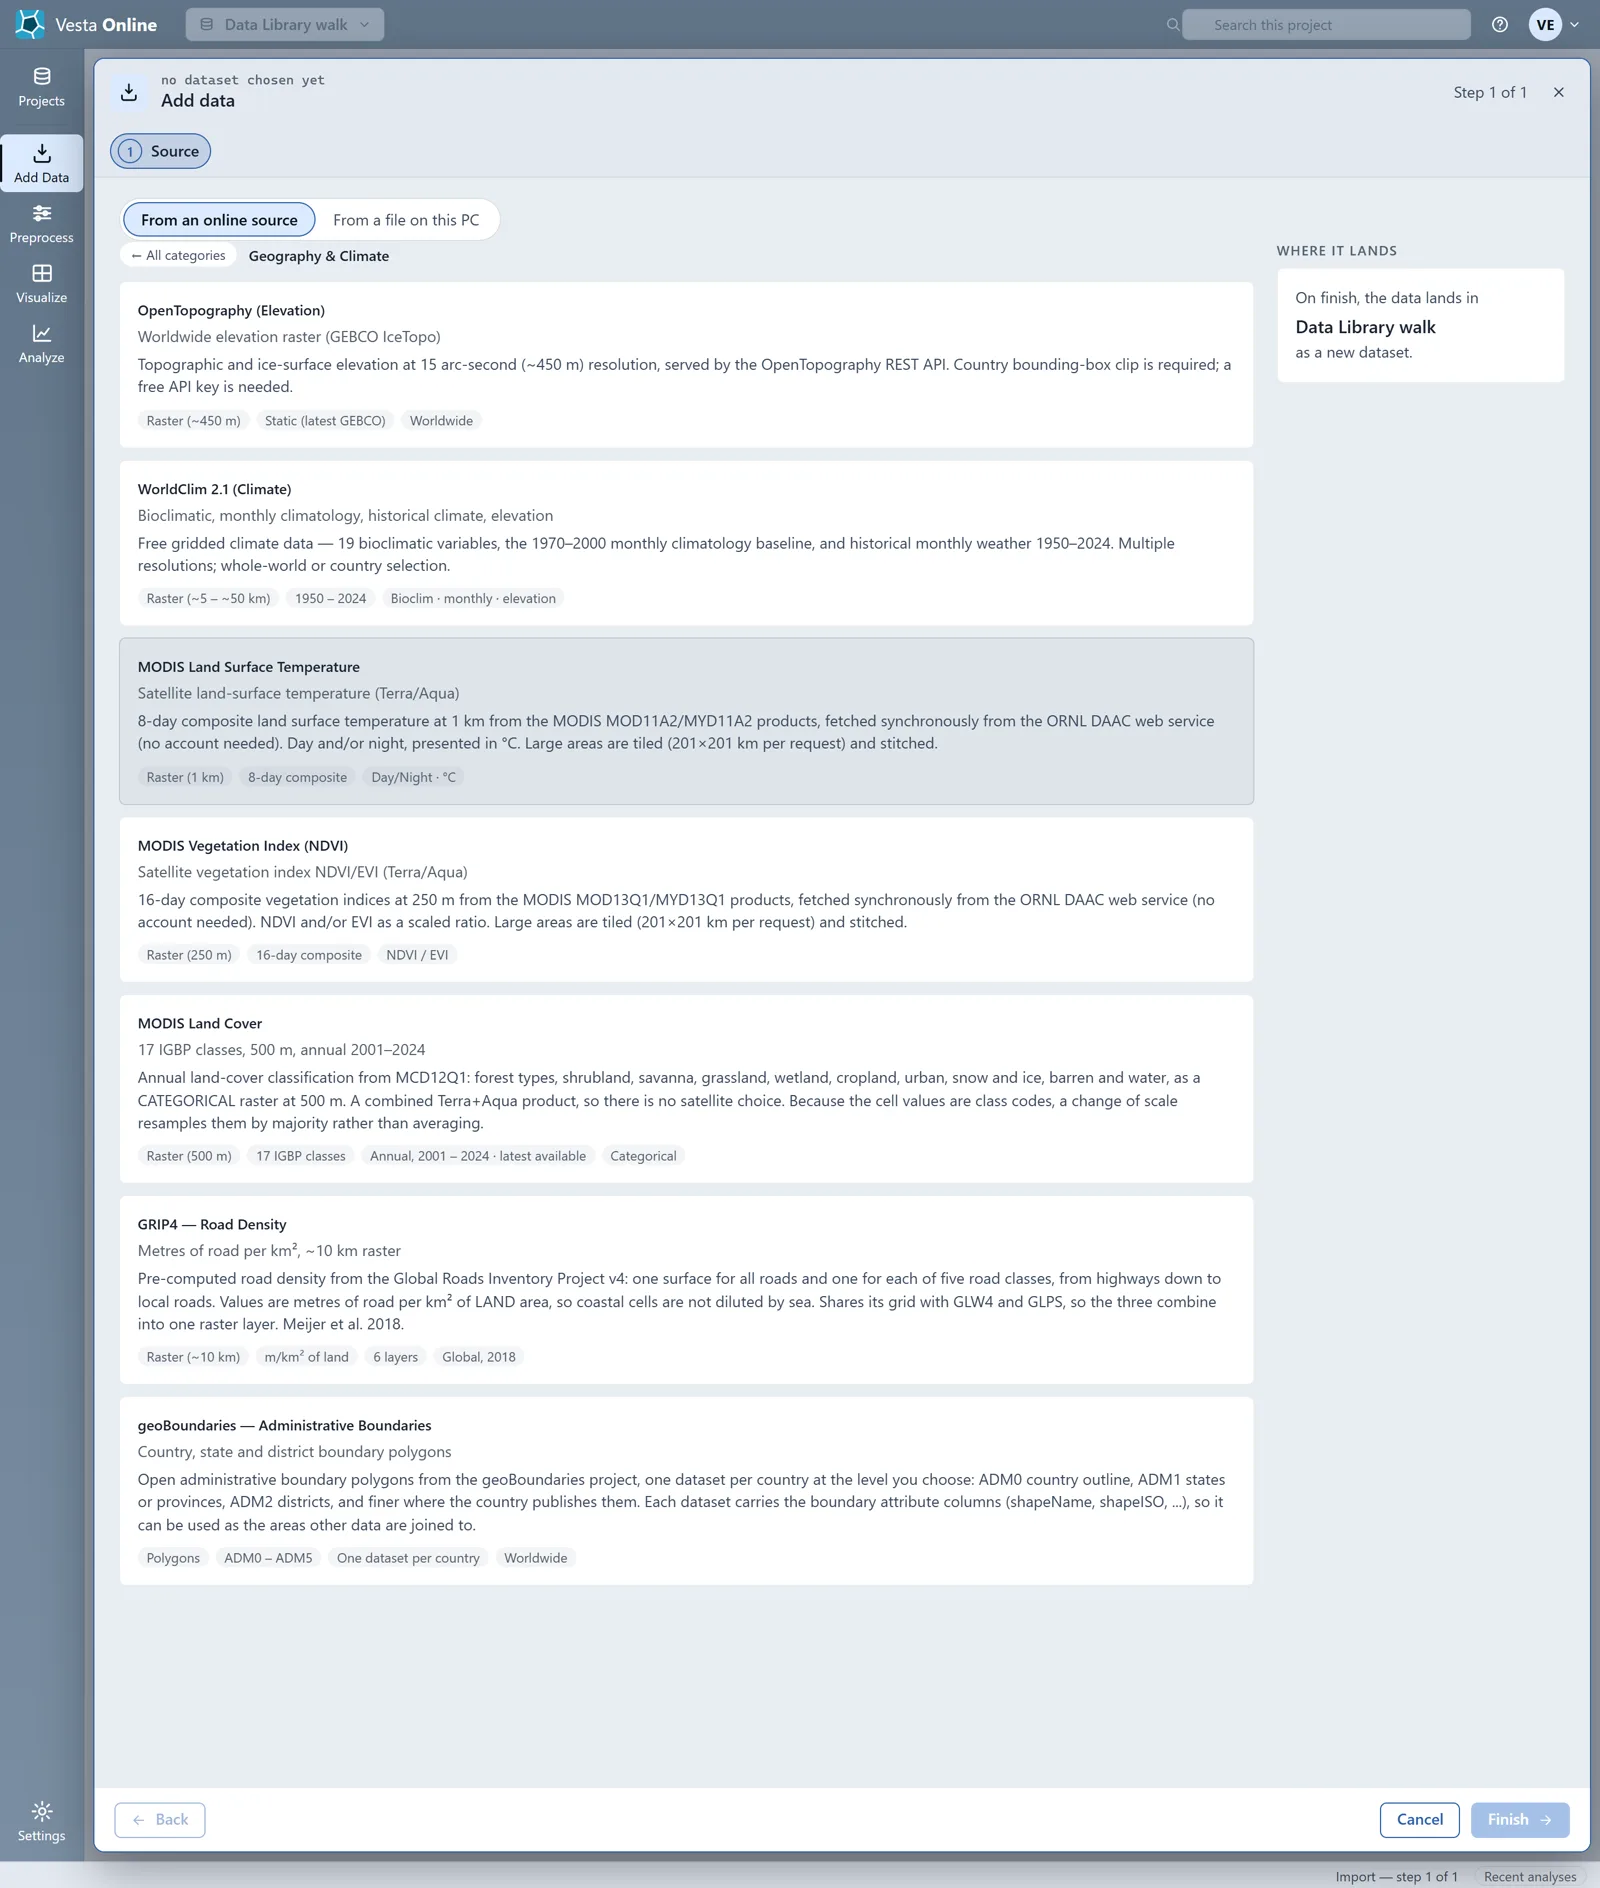
Section titled “Geography and Climate”| Source | Publisher | Geography | Years |
|---|---|---|---|
| OpenTopography (Elevation) | GEBCO, served by OpenTopography | Raster, about 450 m | Static (latest GEBCO) |
| WorldClim 2.1 (Climate) | WorldClim | Raster, about 5 to 50 km | 1950 to 2024 |
| MODIS Land Surface Temperature | MODIS, via the ORNL DAAC web service | Raster, 1 km | 8-day composite |
| MODIS Vegetation Index (NDVI) | MODIS, via the ORNL DAAC web service | Raster, 250 m | 16-day composite |
| MODIS Land Cover | MODIS (MCD12Q1) | Raster, 500 m | Annual, 2001 to 2024, latest available |
| GRIP4 Road Density | Global Roads Inventory Project (Meijer et al. 2018) | Raster, about 10 km | 2018 |
| geoBoundaries | geoBoundaries project | Polygons, ADM0 to ADM5 | No year range on the card |
OpenTopography needs a country bounding box and a free API key, as its card says.
Just for Fun
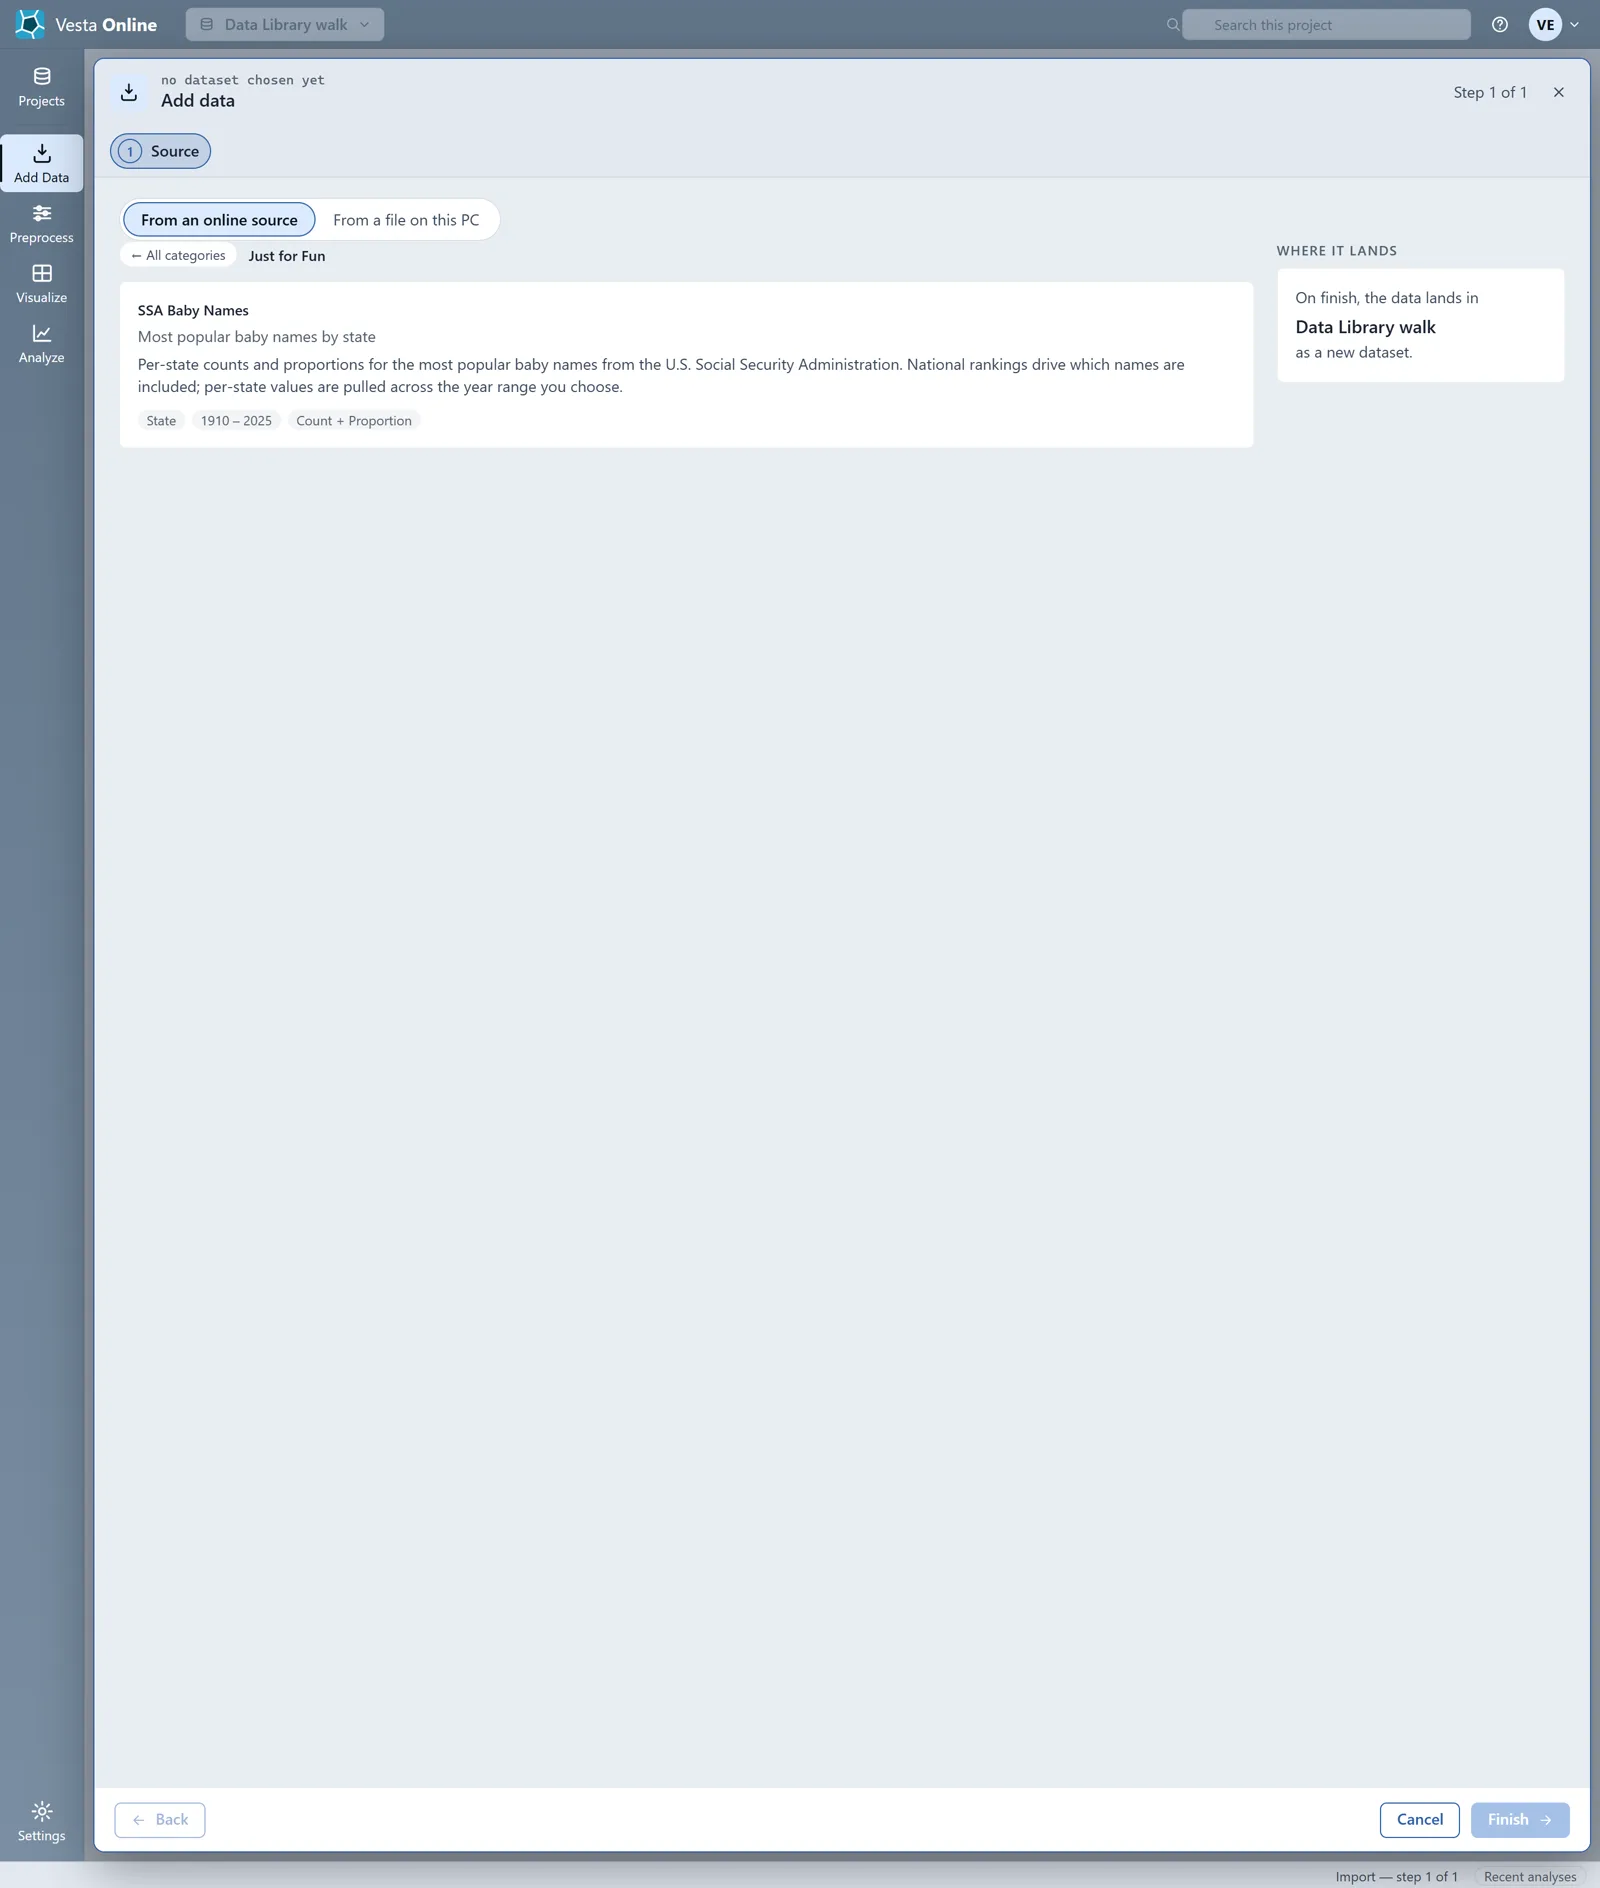
Section titled “Just for Fun”| Source | Publisher | Geography | Years |
|---|---|---|---|
| SSA Baby Names | Social Security Administration | State | 1910 to 2025 |
One source, step by step
Section titled “One source, step by step”This walk takes ACS 5-Year Detailed Tables to the Review step and stops before the import. The steps a source offers depend on the source; the Census sources add Years, Geography, Table and Variables.
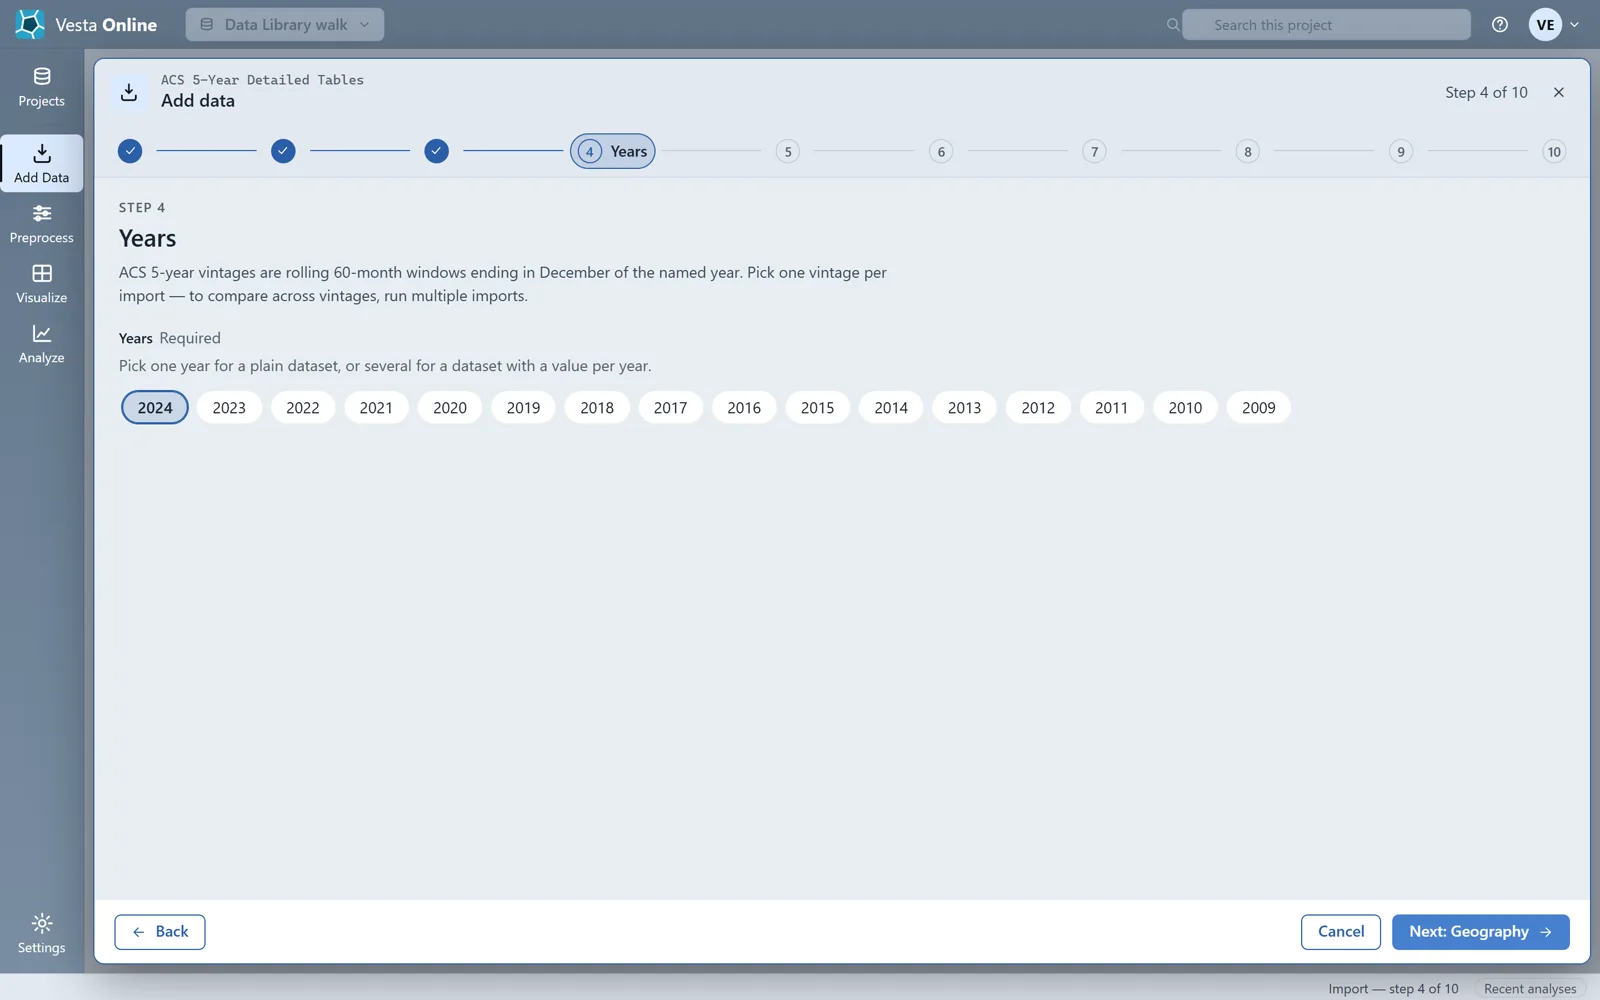
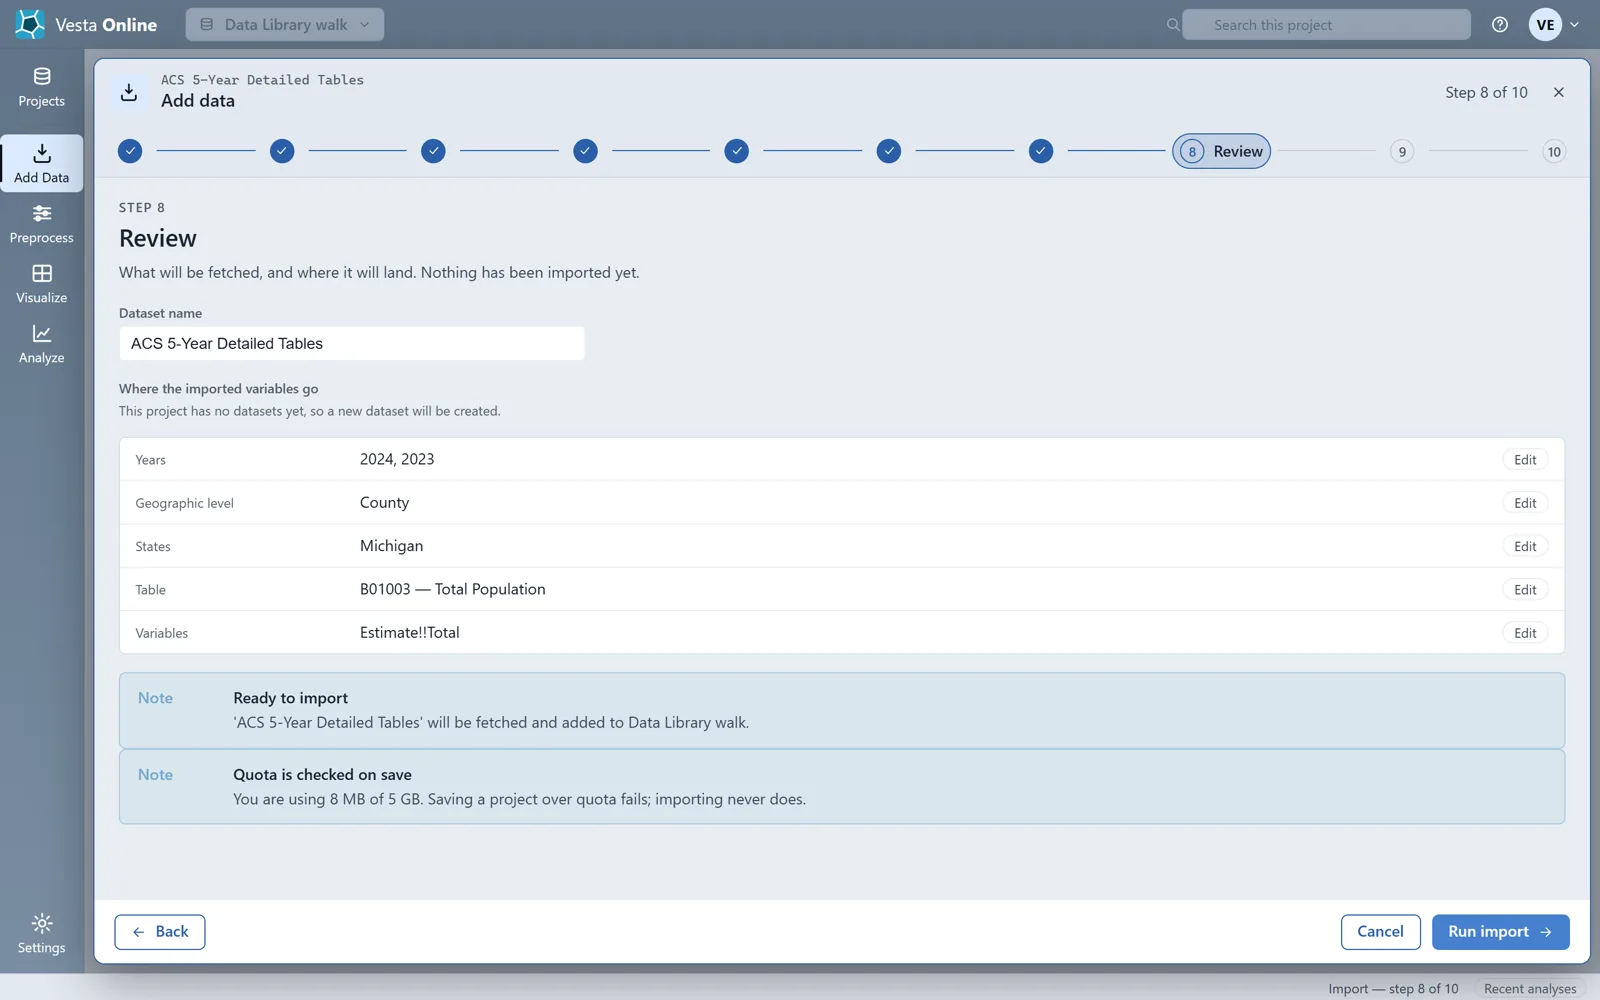
The Review step in this run lists the years as 2024 and 2023: 2024 was already selected when the walk added 2023.
The ACS geography levels this walk saw are State, County, Census Tract, ZCTA, Place, Block Group and Metro Area. To run the import, and to see the Summary, renaming and removing an import, read Importing data.
Where next
Section titled “Where next”- Import from a source, or from your own file: Importing data.
- Map the imported data and run a first analysis: Quickstart.
- Share the project with a colleague: Sharing.