Kriging
Estimate a variable between sample points: choose a variogram model, set the output grid, check with cross-validation and read the estimate and variance maps.
Kriging predicts a variable at places you did not measure, using the observations you did, weighted by a variogram model so that nearby observations count for more. This walk-through uses the Well-water arsenic sample (186 wells), copied into a new project. It fits the variogram inside the kriging flow, checks the result with leave-one-out cross-validation and reads the maps and the report. The walk covers fitting the variogram inline, setting the model by hand and turning auto-fit back on, switching anisotropy on at Full control and off again, Ordinary kriging, a new grid and leave-one-out cross-validation, and then choosing a saved model to krige through (that second run was set up, not run); the screenshots come from the first run. Other options (the Automatic guidance level, the Fit automatically source, Manual lag mode, an existing geography and the other validation schemes) are described from Vesta’s own text and were not walked.
Variography, a separate analysis, fits and saves a variogram model without interpolating.
The steps
Section titled “The steps”- Open the sample projectOpen a project that holds your point data. This walk uses a copy of the Well-water arsenic sample, so the sample itself stays untouched. Its one dataset, Salt Lake County wells, has 186 wells.
- Choose KrigingChoose Analyze, then Estimate values between samples, then Kriging. The first step asks which variable the surface should be interpolated from.
- Choose the variableChoose Arsenic (µg/L) under Variable. Objects with a missing value contribute nothing: they are left out of the kriging system, not treated as zero. Choose Next: Variogram.
- Fit the variogram hereOn the Variogram step choose Fit a model here. Tick Keep the fitted variogram so that the model is written to the project (the box starts unticked). The flow grows from 8 steps to 11 by adding Experimental, Model and Anisotropy. On Experimental, leave the estimator on Traditional and the lag count at 20. The plot beside the settings shows the experimental points, the fitted curve and a dashed line for the variance of the data, and refits as you change a setting.
- Choose the modelOn Model, leave the family on Auto, which tries Spherical, Exponential and Cubic and keeps the best fit. Vesta fits the nugget, sill and range. The model is saved to the project under the name shown in Variogram name, by default the variable's name followed by Variogram.
- Or set the model by handTo set the fit yourself, clear Auto-fit model, sills & ranges on Model. The nugget field and one card per structure, with its type, sill and range, appear, starting from the last fit, and the plot draws the curve you enter against the points. This walk sets the nugget to 300, and the fit numbers beside the plot change to match.
- Turn auto-fit back onTick Auto-fit model, sills & ranges again to return to the fitted model. The hand-set nugget no longer shows beside the plot.
- Check for anisotropyOn Anisotropy, leave Include anisotropy off for one range in every direction. This walk leaves it off first.
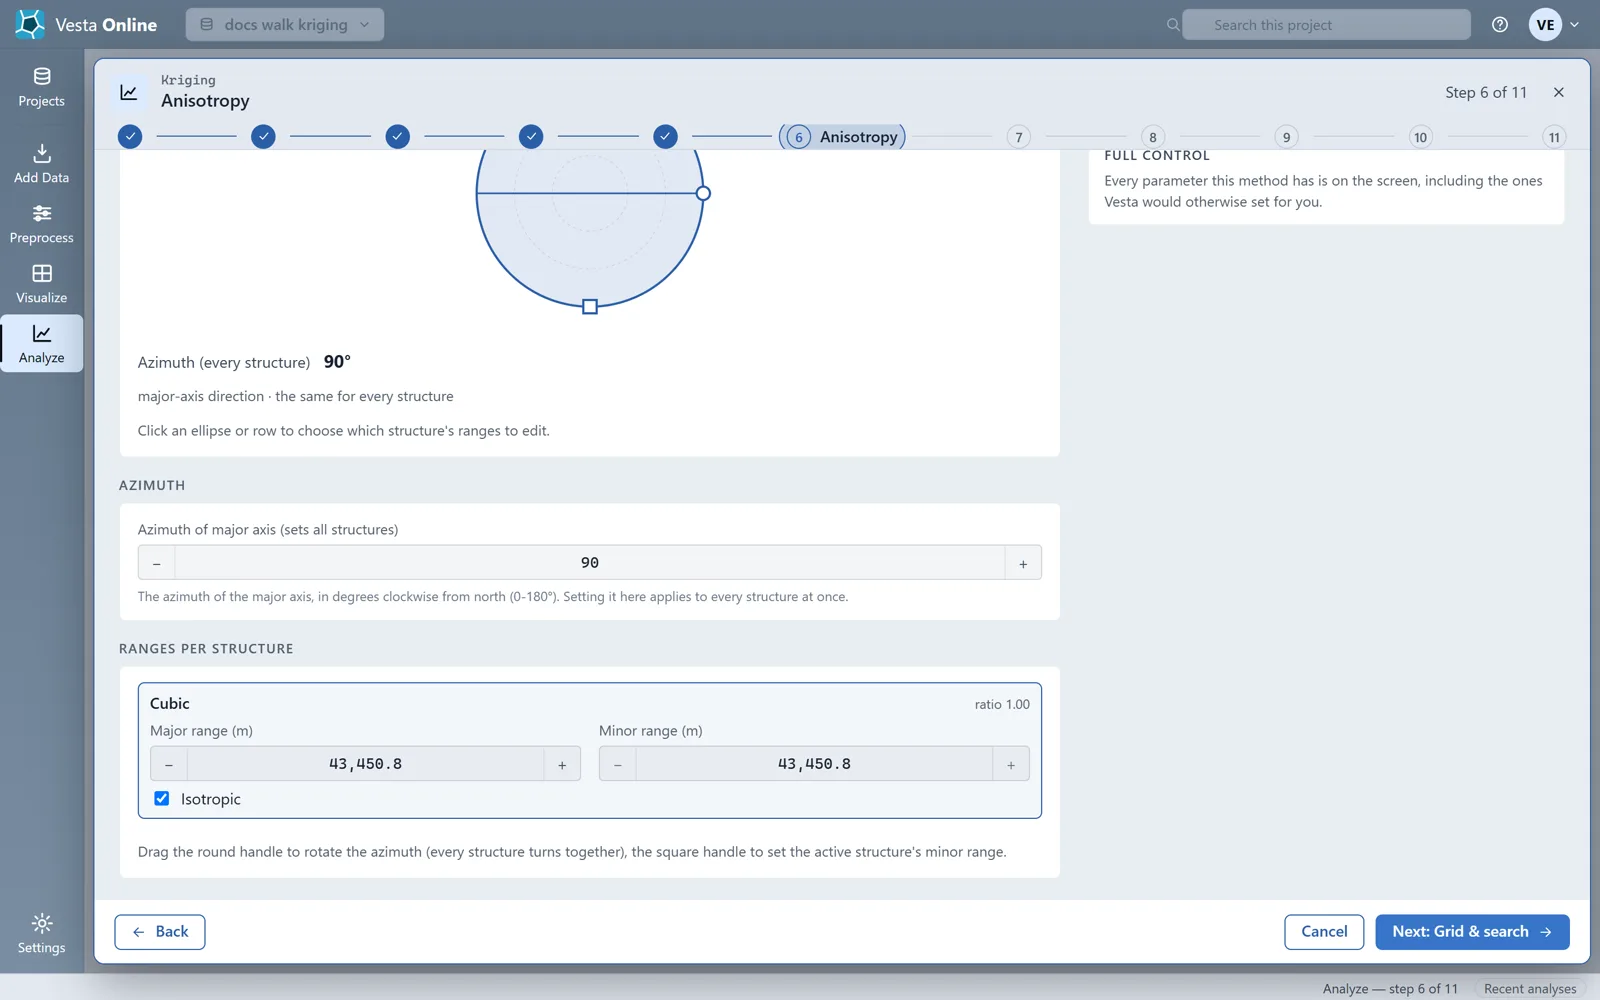
- Or turn anisotropy onTick Include anisotropy and raise the guidance level to Full control. Lags & bins and a Specification appear. Auto-detect fits the direction and ranges from the data and reports what it detected, with a confidence and a direction; here it reports no significant anisotropy. Choose Manual to enter the azimuth of the major axis, one value for every structure, and each structure's major and minor ranges, or drag the round handle on the ellipse to set the azimuth; dragging it due east set the Azimuth field near 90. With anisotropy on, the plot shows the experimental points in four directions.
- Turn anisotropy off againClear Include anisotropy and return the guidance level to Guided to continue with the isotropic fit.
- Set the gridOn Prediction surface, leave the output on A new grid and the Target output cells at 2,500. This is a ceiling on the number of cells, not an exact count: the field says at most 2,500 cells, and the exact mesh depends on the extent. The search takes the 16 nearest observations for each cell.
- Pick the kriging typeOn Options, leave Ordinary selected. Ordinary re-estimates the mean inside each neighborhood, so no global mean has to be known.
- Choose a cross-validationOn Validation, choose Leave one out. It predicts every observation in turn from all the others, which is the most thorough check and the slowest, so it suits small samples like this one.
- Run the krigingChoose Run analysis. The Summary step lists what was saved: the variogram model, a report, an analysis summary, the output grid and the variables Kriging Estimate, Kriging Variance, CV Residuals and CV Predicted.
- Open the result workspaceChoose Open in workspace. The result workspace opens with the written summary, a map of Kriging Estimate and a map of Kriging Variance.
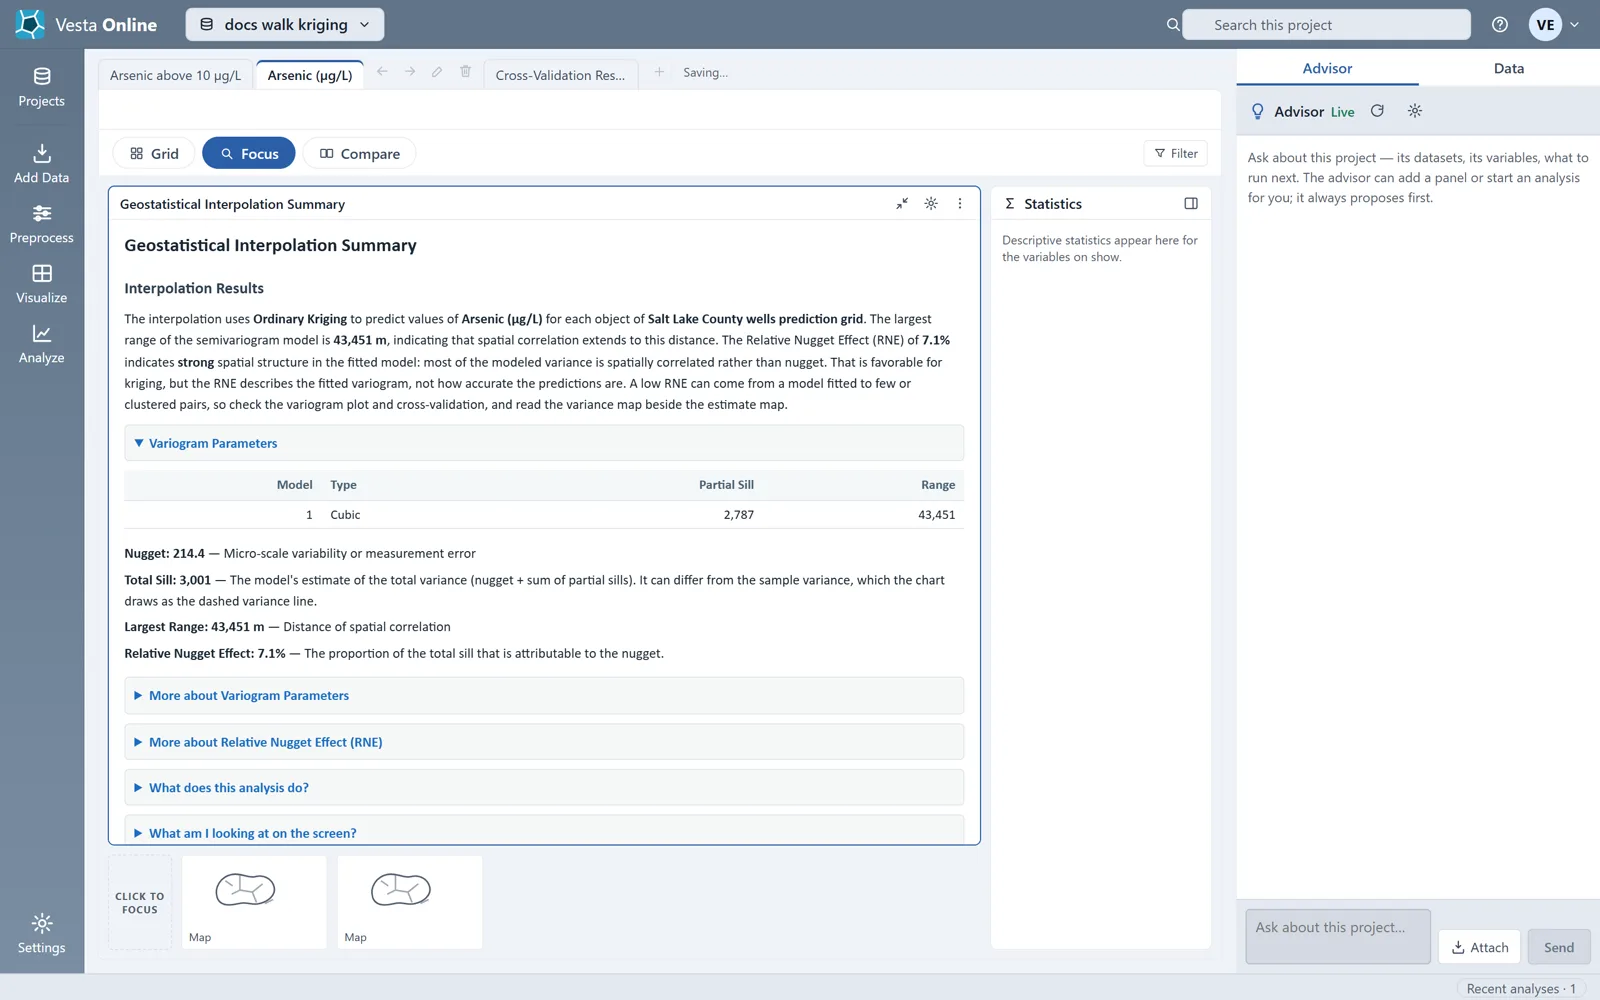
- Read the summaryUse Focus on the summary panel to read it full width. It reports the kriging type, the variogram parameters and what to check.
- Read the cross-validationOpen the Cross-Validation Results tab. It holds the error metrics, a residual map, observed against predicted values, a histogram of the residuals and a statistics table.
- Or save a model with Variography firstInstead of fitting inside kriging, run Variography to fit and save a model: Analyze, Describe spatial structure, Variography. Choose the dataset and the variable, and on Model give the fit a name. Choose Save variogram.
- Choose the saved modelStart Kriging again, choose the variable and, on the Variogram step, choose Use a saved model. Pick the saved model from the Variogram model list. The Experimental, Model and Anisotropy steps do not appear, and the rail stays at 8 steps.
What you should see
Section titled “What you should see”Three ways to get a variogram
Section titled “Three ways to get a variogram”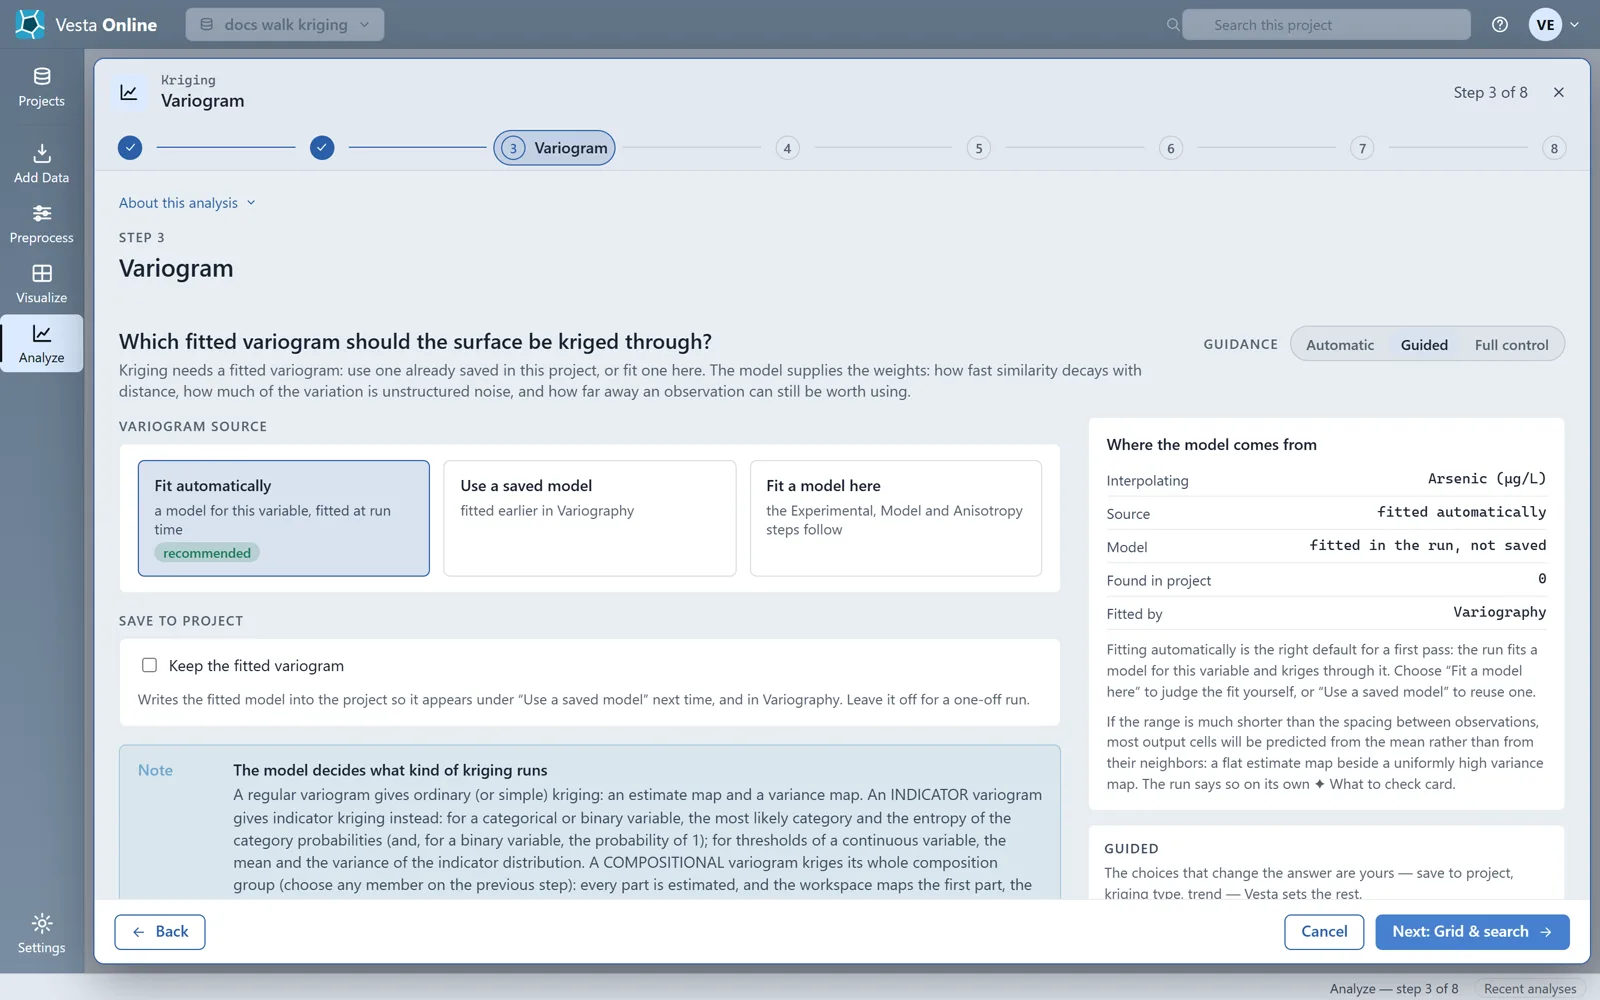
Kriging needs a fitted variogram model. Either fit one inside the kriging flow, or reuse one already saved in the project. Fit automatically fits a model for the variable when the run starts; its optional overrides are at Full control, and the model is written to the project only if you tick Keep the fitted variogram. Fit a model here adds the Experimental, Model and Anisotropy steps, so you can see and change the fit. Use a saved model reuses a model saved in the project, from Variography or from a kriging run with Keep the fitted variogram ticked. A model fitted on the raw values serves Simple and Ordinary kriging. A model fitted with a trend serves Universal kriging with the same trend.
Fitting the variogram
Section titled “Fitting the variogram”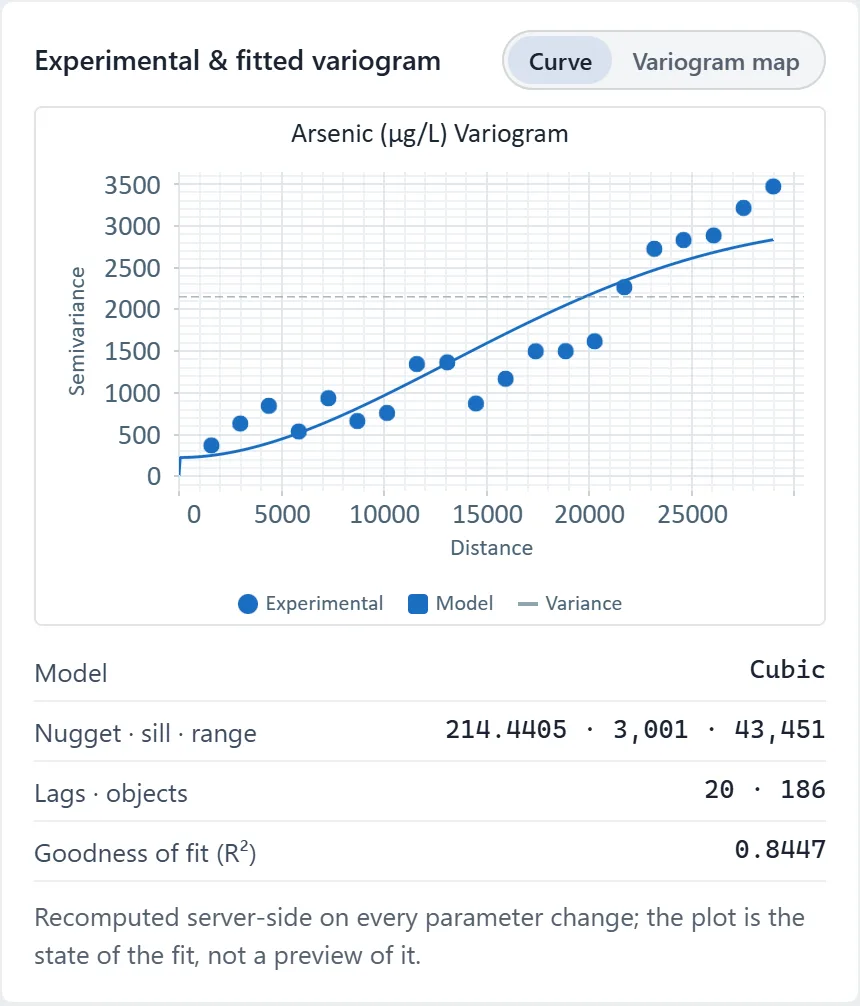
On Experimental, each point is one lag bin: the mean semivariance of the pairs of wells whose distance falls in that bin. Long-range lags carry few pairs and are the noisiest, so they should not drive the fit. The estimators on this step are Traditional, Standardized and Weighted; Weighted needs a weight variable and reports an error until you choose one. The Spatio-temporal option stays off for a dataset measured at one time.
By default Vesta chooses the lag width from the extent of the data. The Lag mode choice, Auto or Manual, appears when you raise the guidance level to Full control. Manual takes a lag width that you type in, so start from Auto. The plot labels its horizontal axis Distance without units.
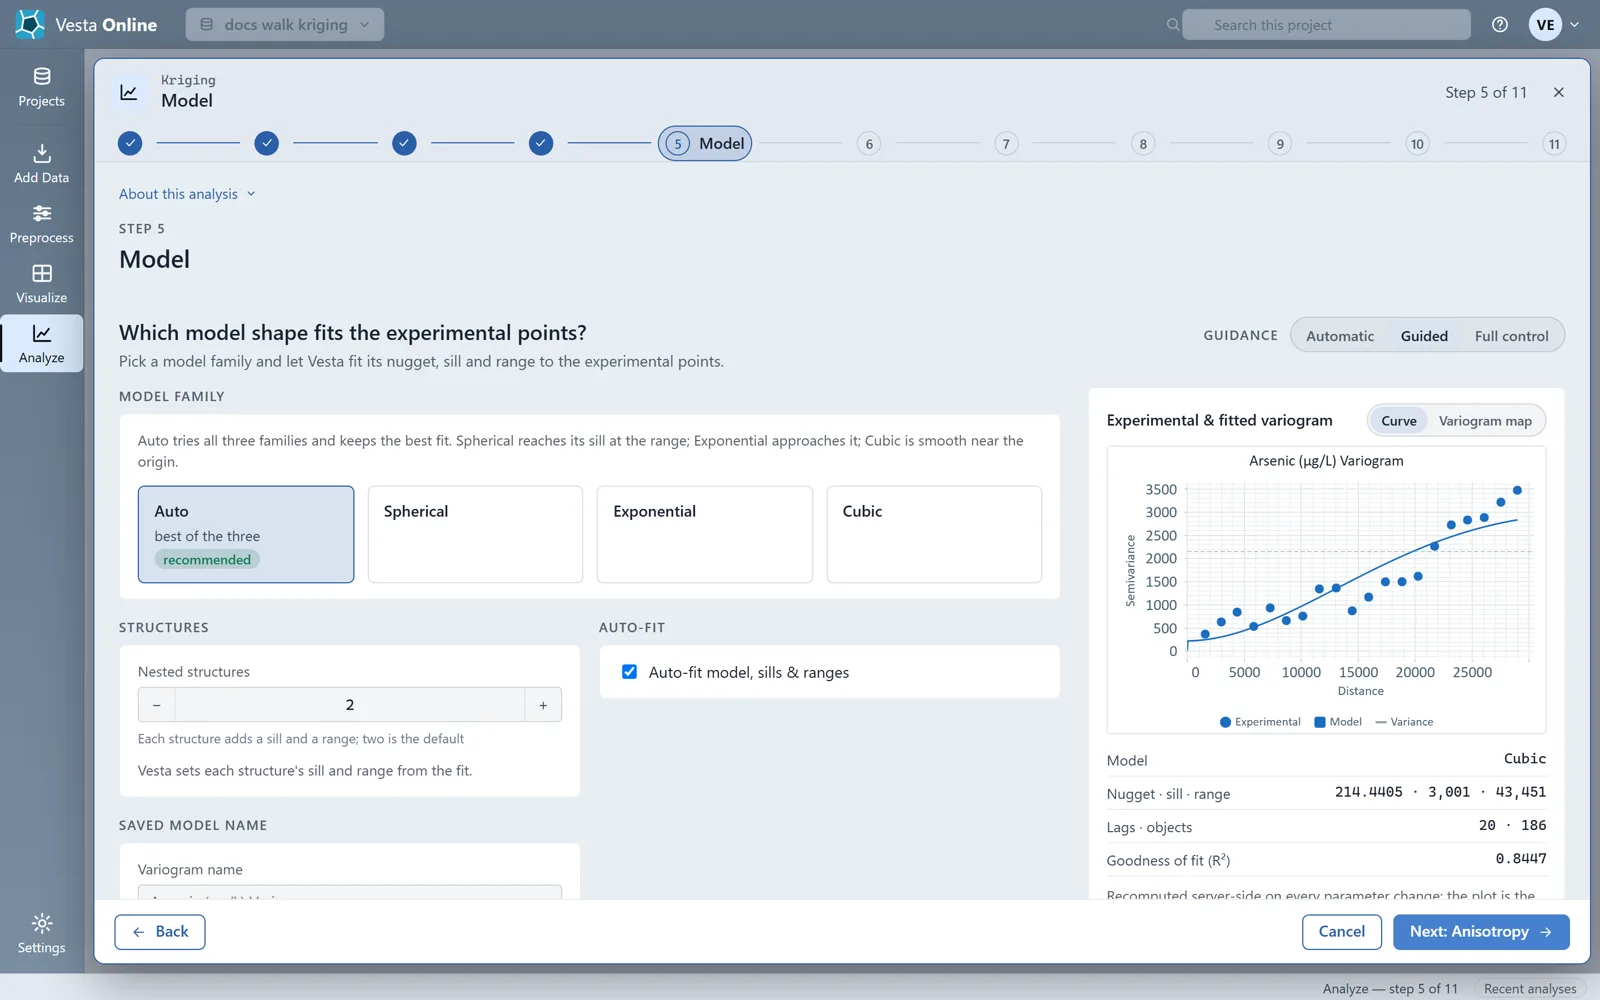
The model families are Spherical, Exponential and Cubic. Spherical reaches its sill at the range, Exponential approaches it, and Cubic is smooth near the origin. R-squared weighs the fitted curve against the points; a tighter fit is not automatically better, so do not over-fit noisy long-range lags. Each nested structure adds a sill and a range; two is the default. With Auto-fit on, Vesta sets each structure’s sill and range from the fit.
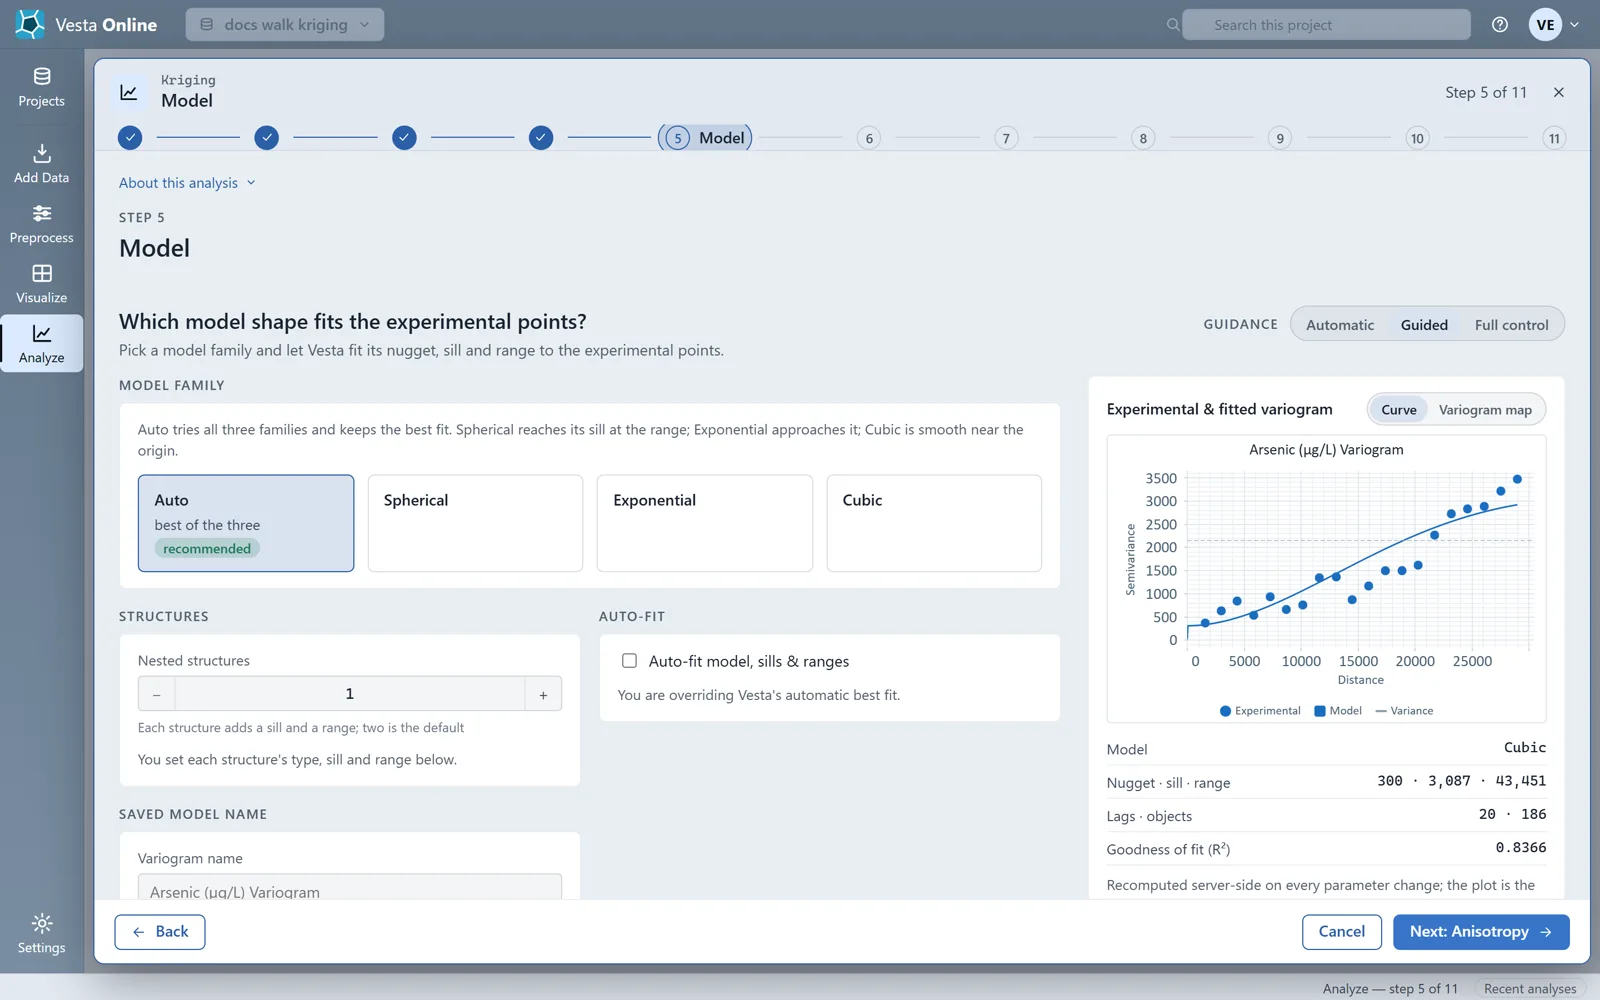
Clearing Auto-fit model, sills & ranges overrides Vesta’s automatic best fit: the model uses the nugget, and each structure’s type, sill and range, that you enter. The fields start from the last fit, and the fit numbers beside the plot change with them. The fields show at Guided, the default level, so there is no need to raise the guidance level. Ticking the box again returns to the fitted model.
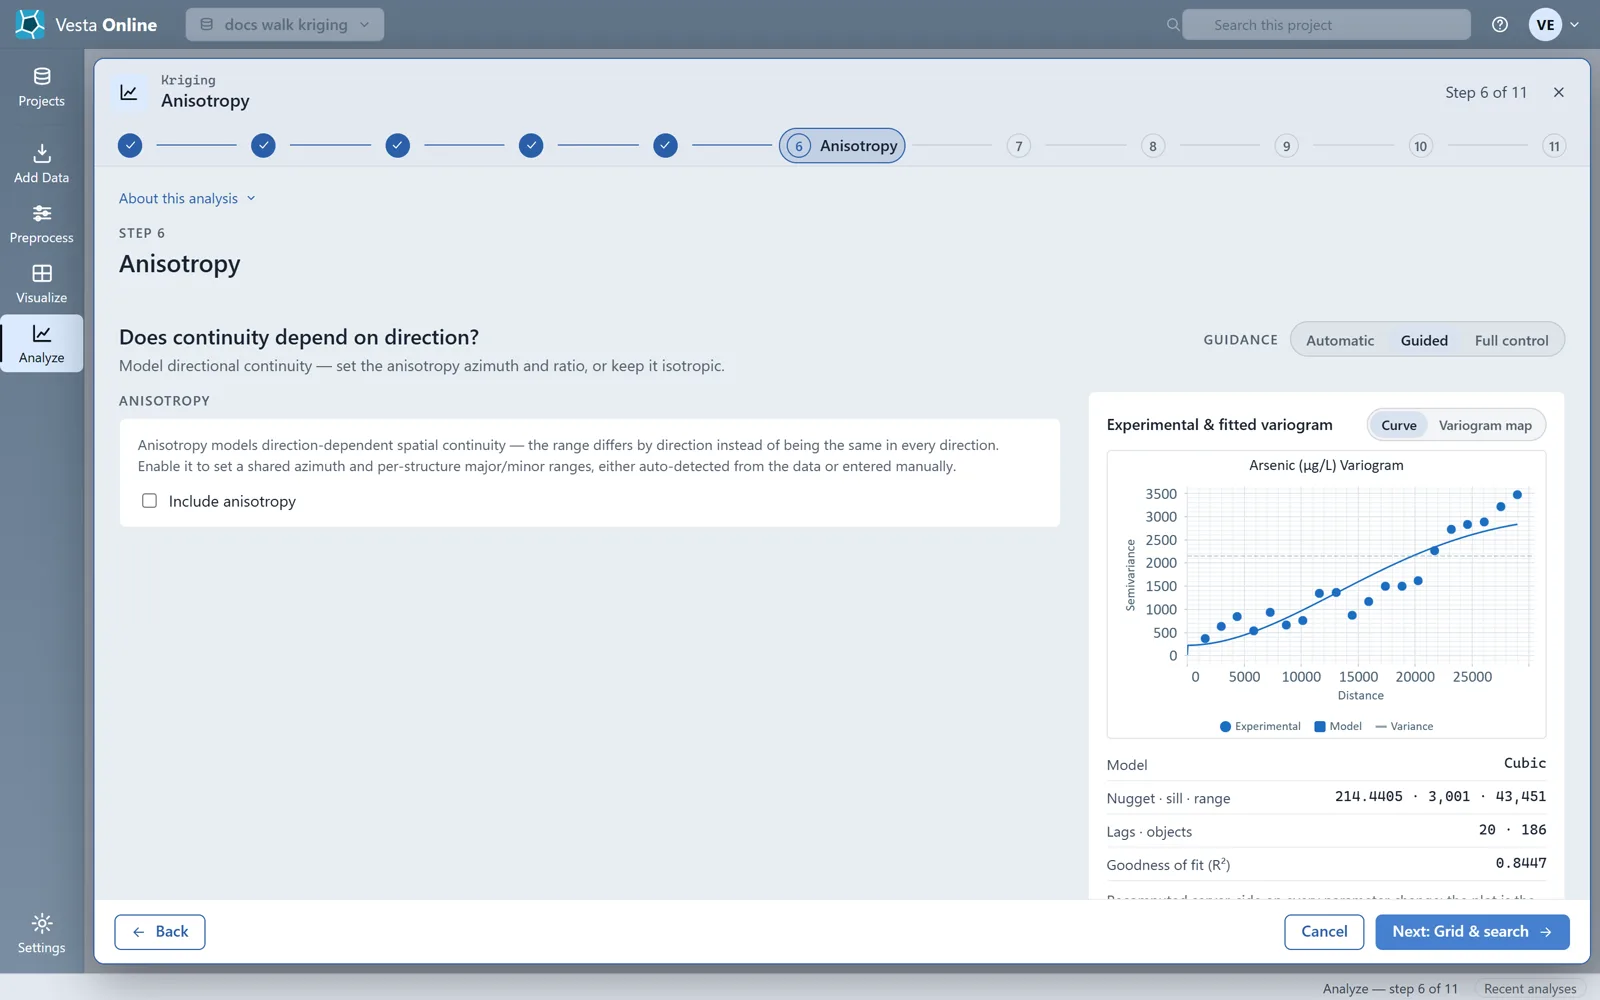
With anisotropy on, the step adds Lags & bins and, at Full control, a Specification, and the pairs are split across four directions. Auto-detect detects the direction during the fit and shows a Detected card with a confidence and a direction; Re-detect anisotropy from data refits. In this run it reported a confidence of 0% and no significant anisotropy. Manual gives you the Azimuth of major axis, in degrees clockwise from north (0 to 180), and a major and a minor range for each structure.
The grid
Section titled “The grid”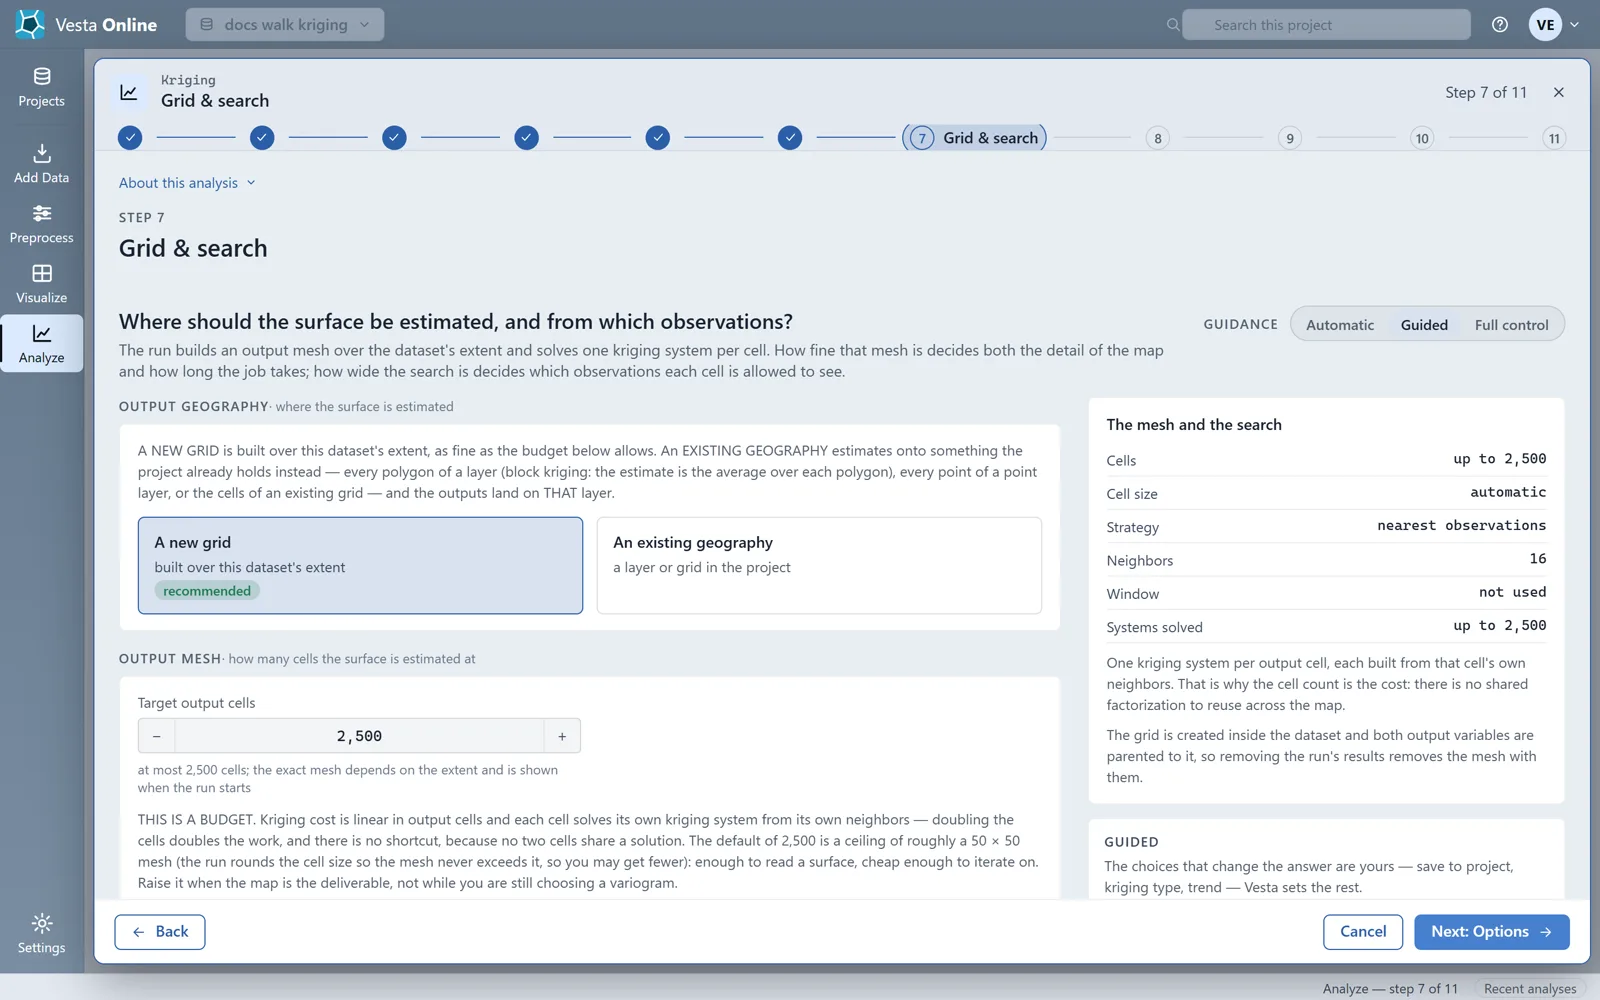
Each output cell solves its own kriging system, so the work grows in step with the number of cells. A new grid is built over the extent of the dataset. This run produced 1,512 cells from a target of 2,500, because the cell size is rounded so the mesh never exceeds the target. Raise the target when the map is the deliverable, not while you are still choosing a variogram. The alternative, An existing geography, estimates onto a layer or grid the project already holds.
Validation and the run
Section titled “Validation and the run”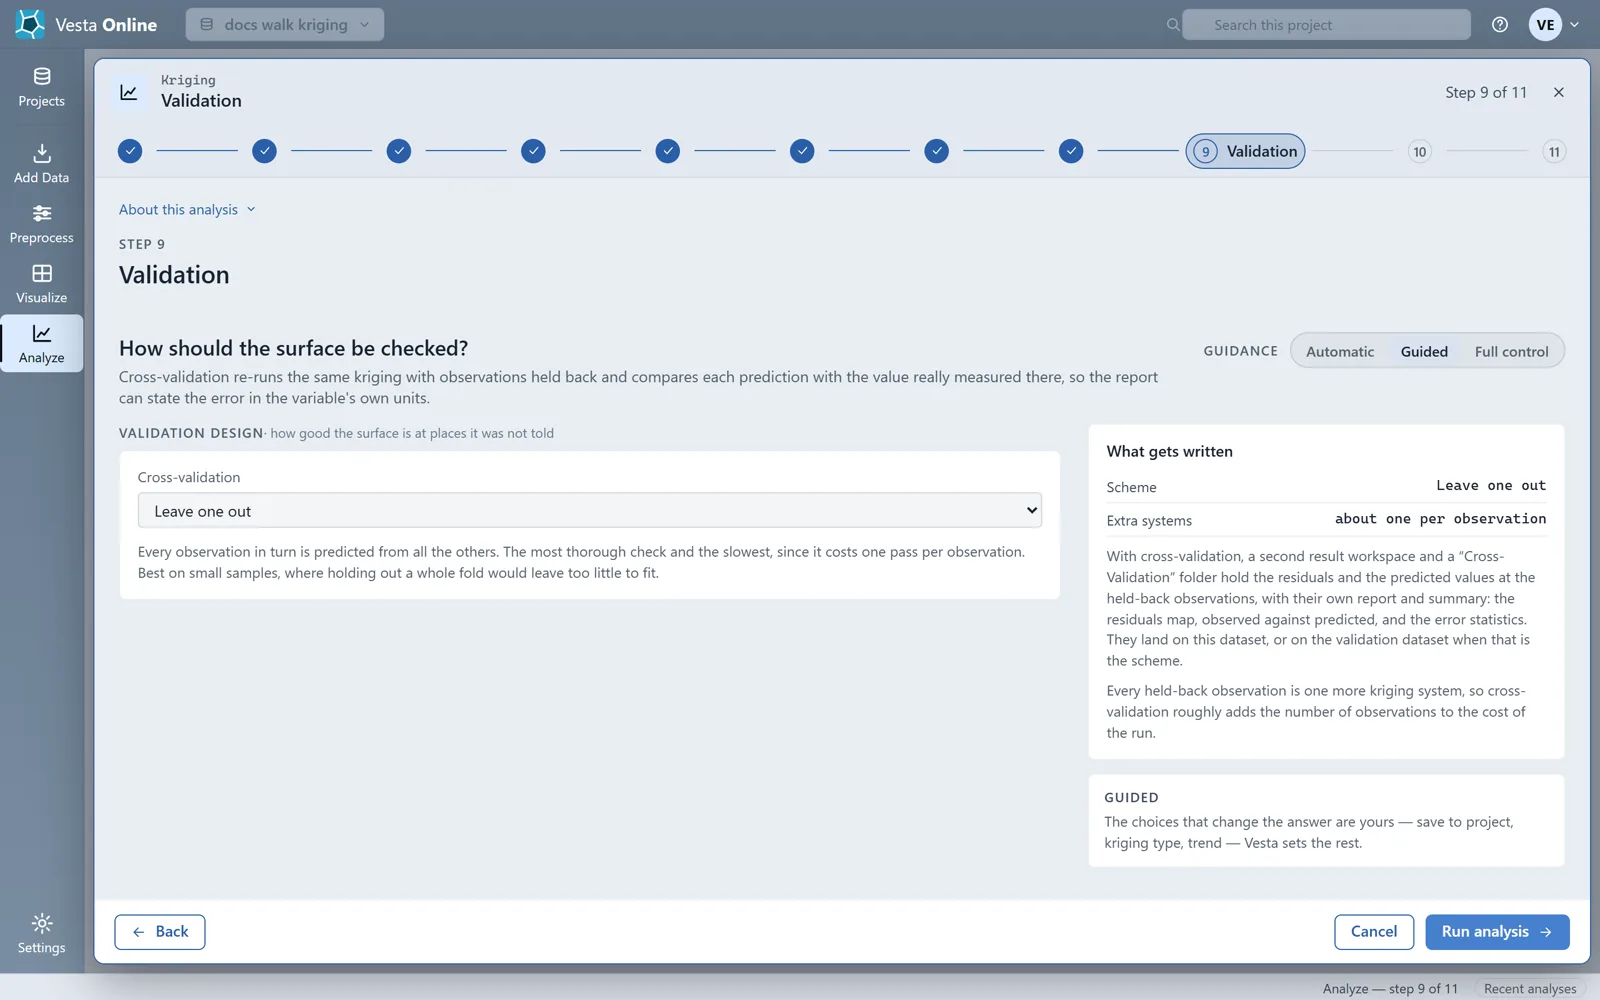
The Cross-validation list offers None, which is the default, Train/test split, K-fold, Repeated k-fold, Spatial blocks, Leave one out and Separate dataset. Cross-validation re-runs the same kriging with observations held back and compares each prediction with the value measured there. With it, the run adds a second result workspace and variables for the residuals and the predicted values. Because every held-back observation is one more kriging system, it adds roughly the number of observations to the cost of the run. Validation appears when the guidance level is Guided or higher.
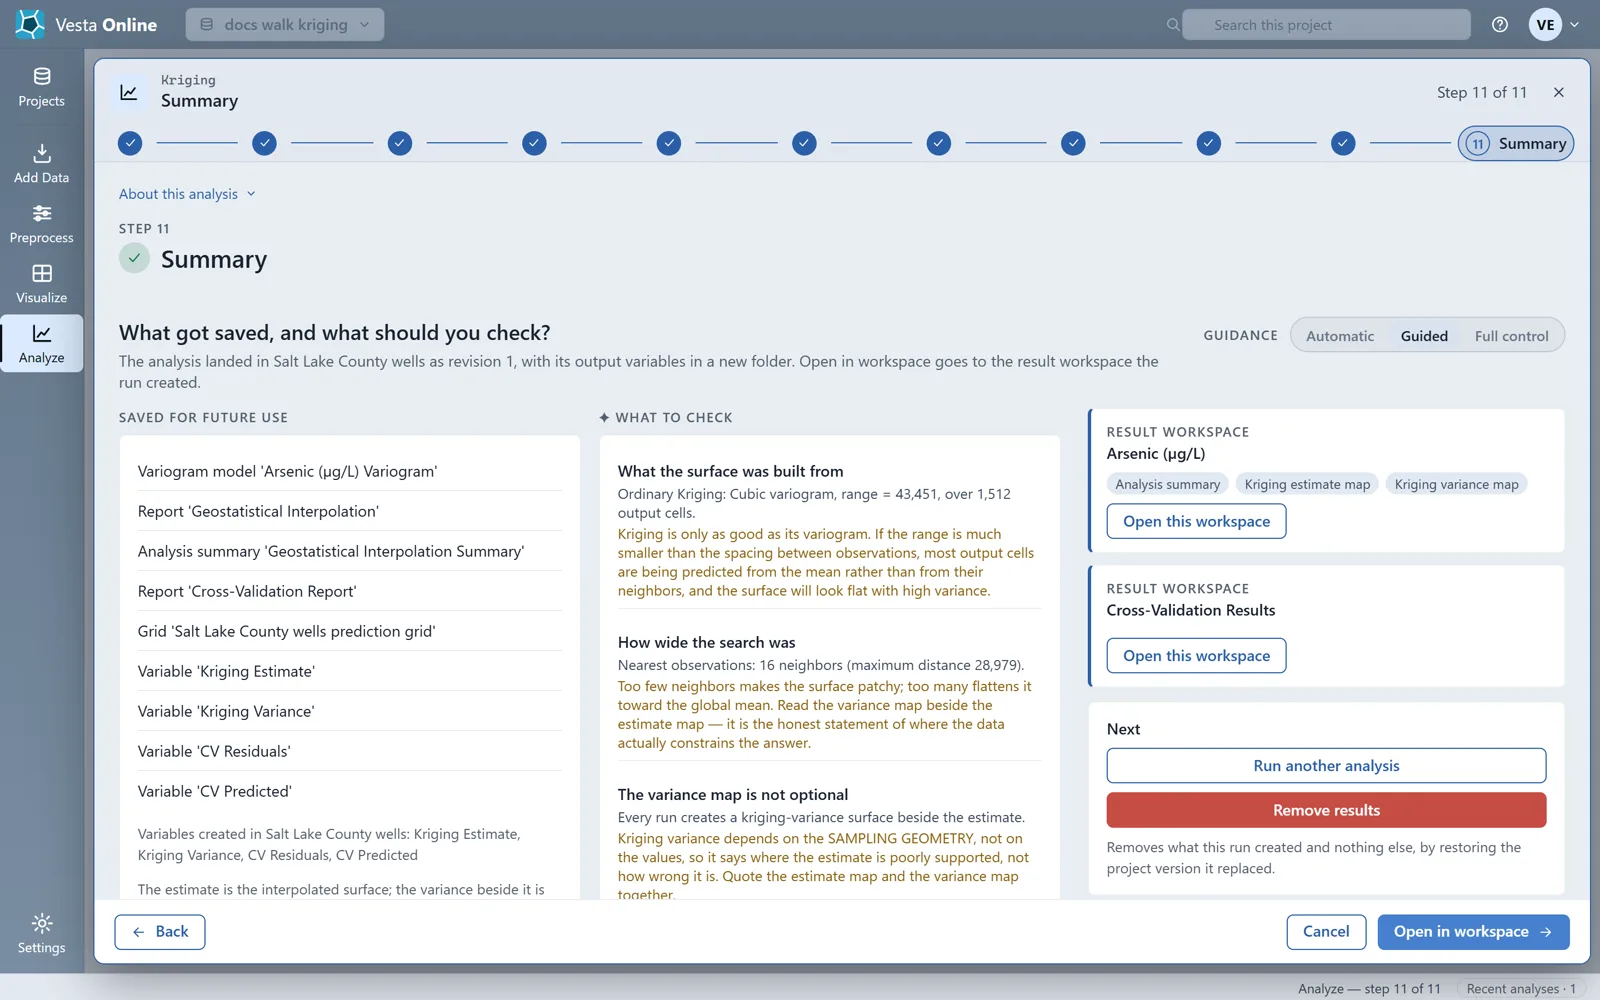
The Summary step lists what was saved and what to check. Only one analysis of yours runs at a time: if you start a second while one is running, the step says so, and you can try again when the first has finished.
The result workspace
Section titled “The result workspace”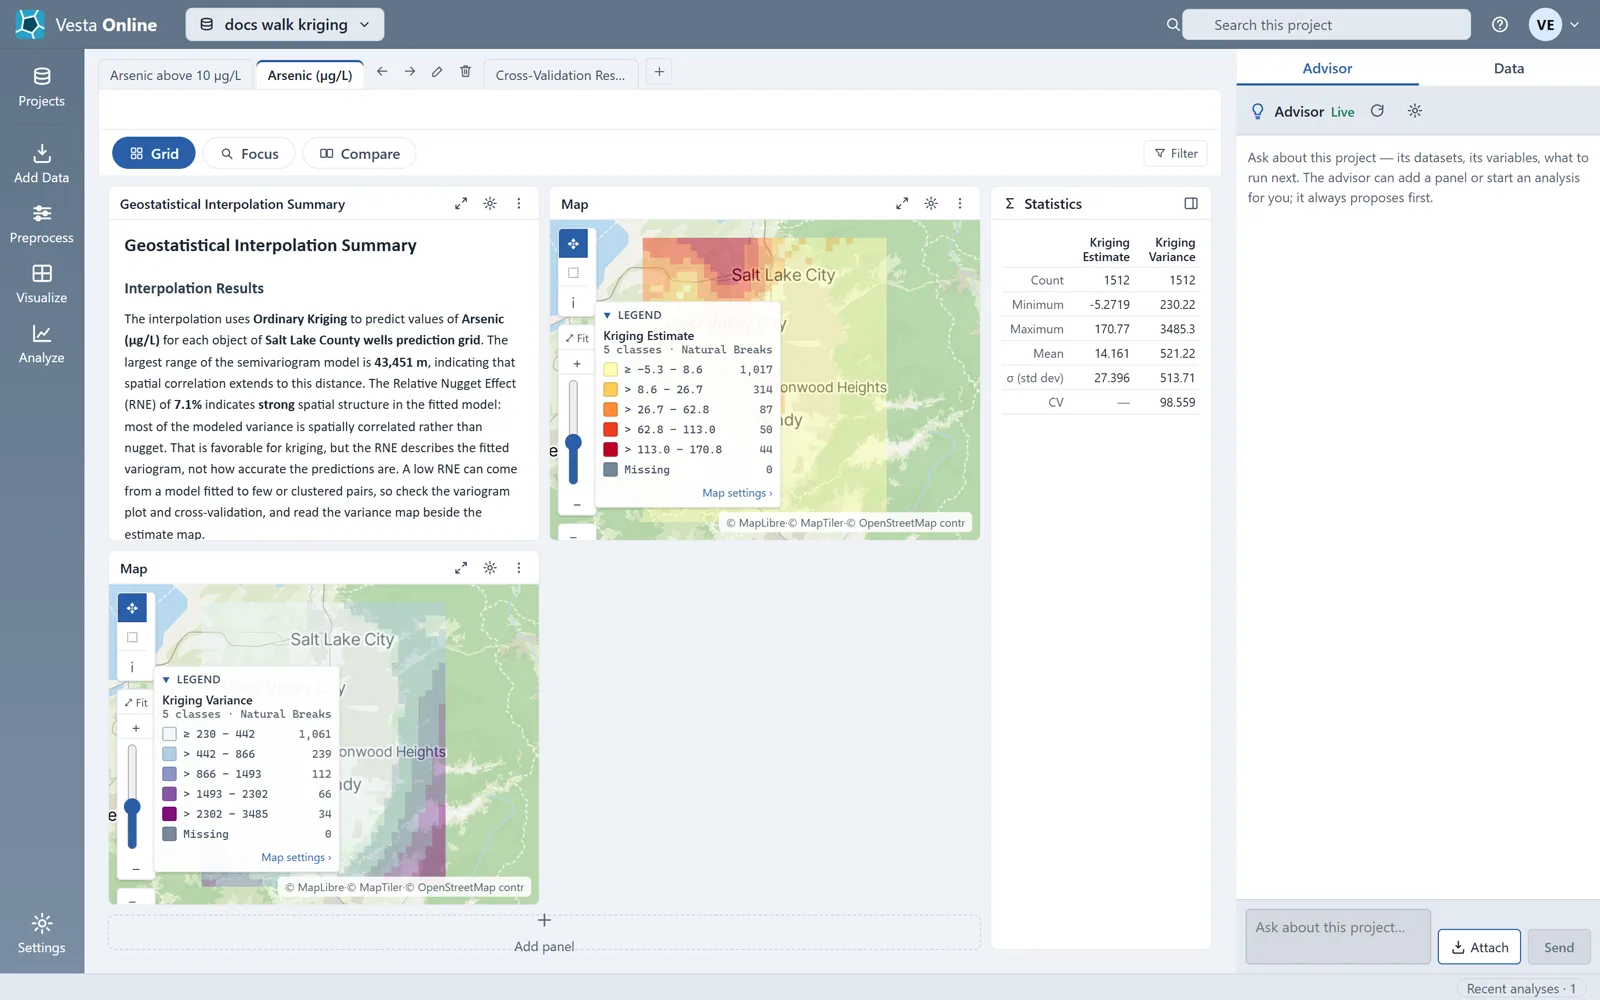
The estimate map shows the predicted value in each cell. The variance map shows where the estimate is poorly supported: kriging variance depends on where the observations are, not on their values. It is higher where observations are few, at the edge of the study area and in sparsely sampled places. Read the two maps together, and use the variance map to see where more samples would help. It tells you where an estimate is weakly supported, not how wrong it is.
Reading the results
Section titled “Reading the results”The summary reports the variogram parameters. The nugget is variation at zero distance, from measurement error or fine-scale variation the sampling cannot resolve. The sill is the maximum variance the fitted model reaches, at the range; it is the fitted value in the summary, and it can differ from the variance of the data that the dashed line on the plot marks. Beyond the range, points are effectively independent.
The relative nugget effect (RNE) is the nugget as a share of the total sill:
| RNE | What it indicates |
|---|---|
| Below 25% | Most variability is spatially structured rather than random noise. |
| 25% to 75% | A mix of spatially structured signal and unstructured noise. Nearby locations are similar on average, but local departures can be pronounced. |
| Above 75% | Variability is dominated by micro-scale heterogeneity, measurement error or point-source effects rather than spatial correlation. |
The RNE describes the fitted variogram, not how accurate the predictions are. A low RNE can also come from a model fitted to few or clustered pairs. Check the variogram plot and the cross-validation, and read the variance map beside the estimate map.
If the range is much smaller than the spacing between observations, most cells are predicted from the mean rather than from their neighbors, and the surface looks flat with high variance. The Variography summary also warns when the range is near or past the maximum lag, which means the fit is extrapolating the far tail.
The cross-validation
Section titled “The cross-validation”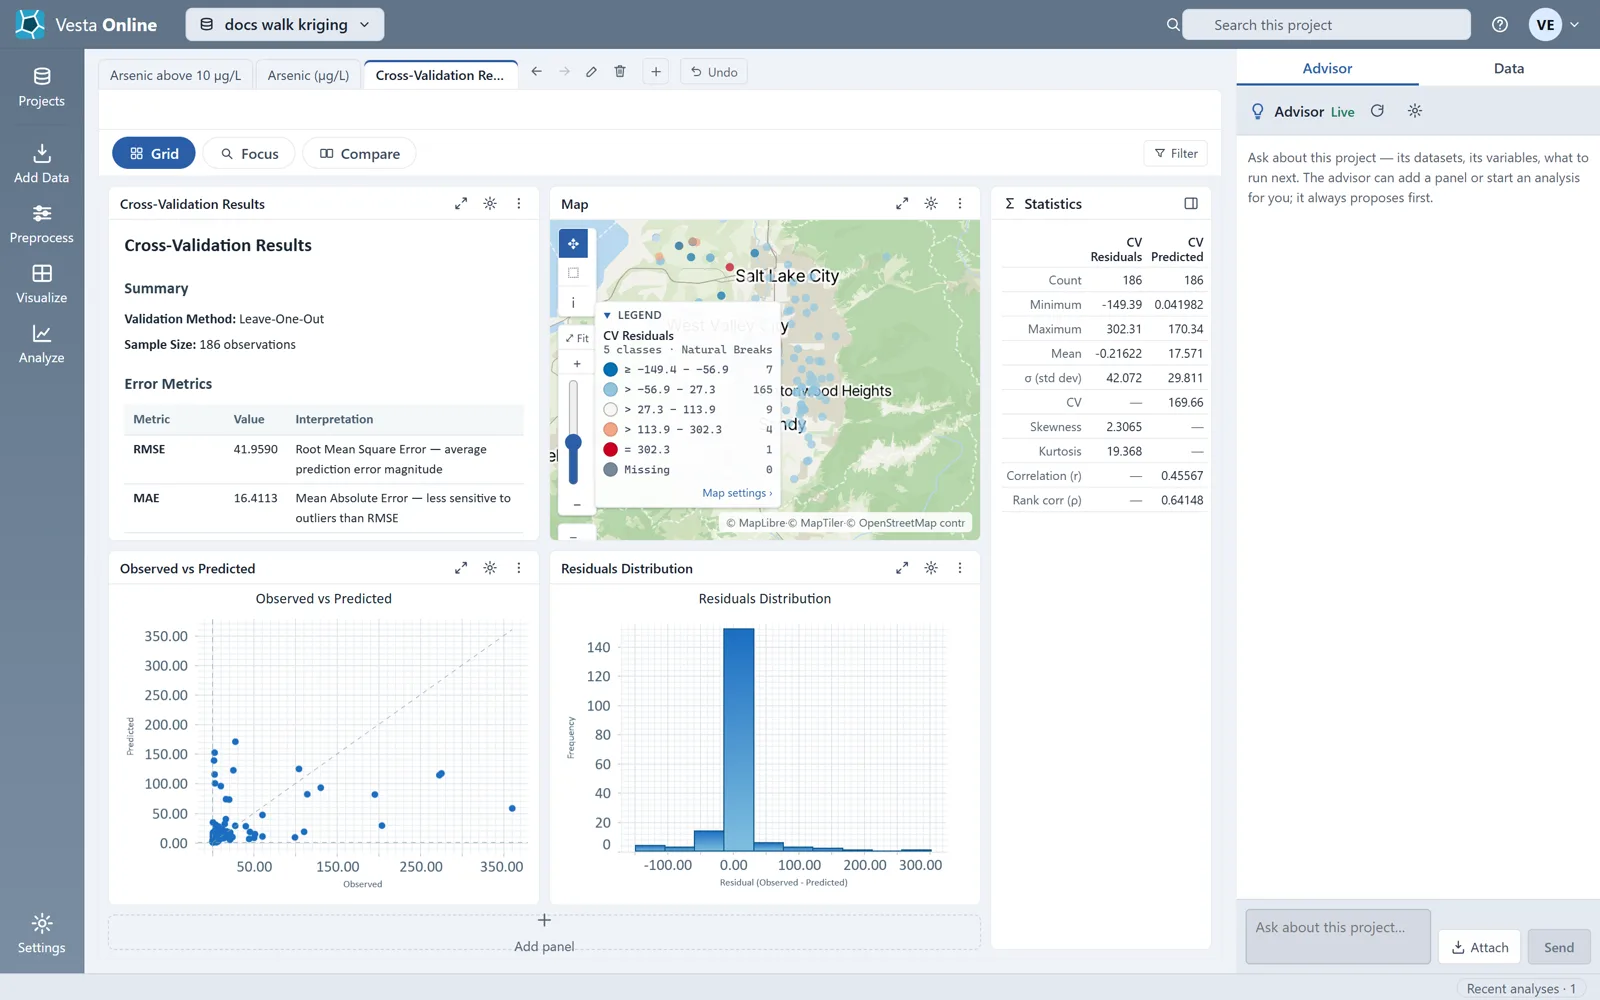
Each metric compares the prediction at a held-back well with the value measured there:
| Metric | What it tells you |
|---|---|
| RMSE | The average size of the prediction error, in the variable's units. Large errors weigh most. |
| MAE | The mean absolute error. It is less sensitive to outliers than RMSE. |
| Mean error | The bias. It should be near zero for unbiased predictions. |
| Median absolute error | A robust measure of the typical error. |
| R-squared | The fraction of variance explained; 1.0 is perfect. |
| Correlation | The Pearson correlation between predicted and observed values. |
| Standardized RMSE | RMSE divided by the standard deviation of the observed values. Values below 1.0 mean the model predicts better than the mean. |
In this run the RMSE was about 42 and the MAE about 16; both appear in the screenshot. The statistics list also reports the median absolute error, R-squared and the standardized RMSE for your own run. Clusters of similar residuals on the residual map point to areas where the model performs poorly. On the histogram, residuals centered at zero with a symmetric, bell-shaped spread are what you want; this histogram is sharply peaked with a long right tail.
The saved-model alternative
Section titled “The saved-model alternative”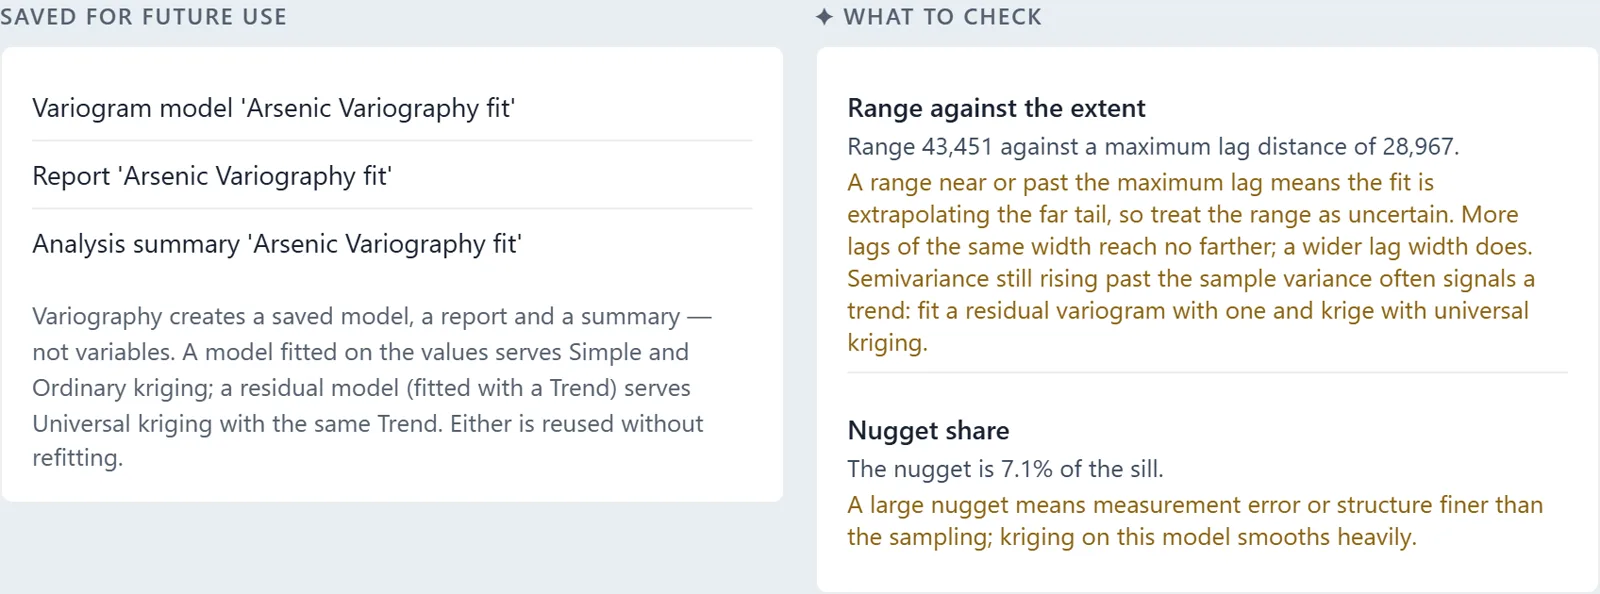
Variography saves a fitted model, a report and a summary, but no variables. A model saved this way is reused without refitting.
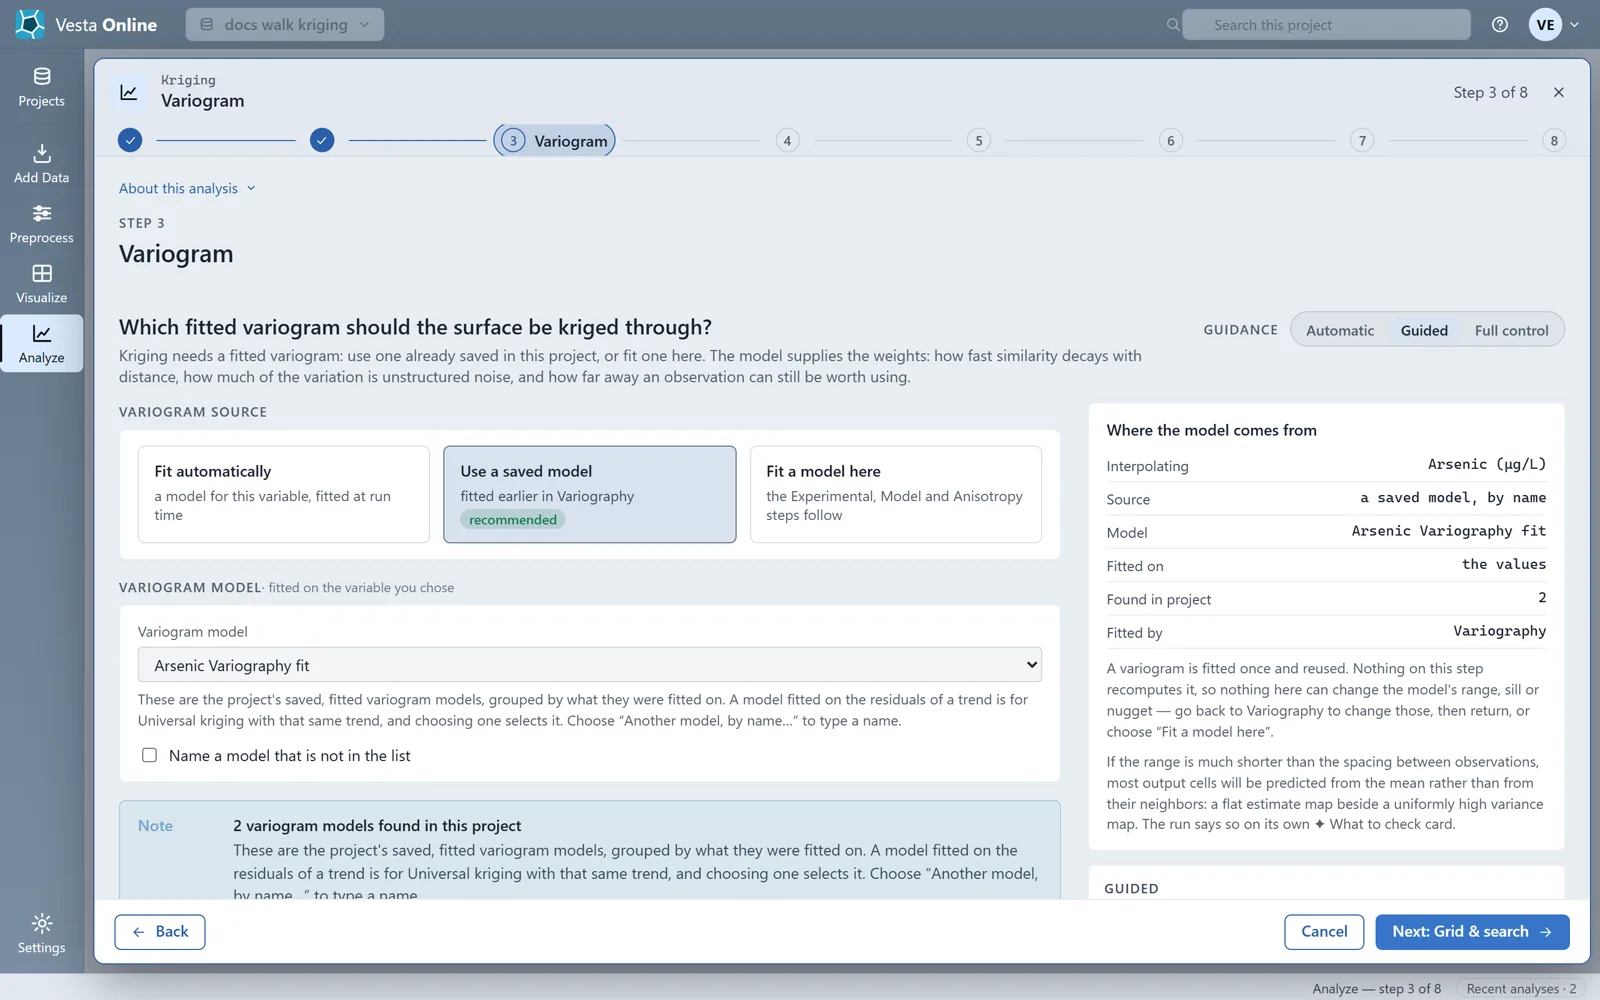
The list shows the project’s saved, fitted models, grouped by what they were fitted on. If a model is not listed, tick Name a model that is not in the list and type its name; the name must match the saved model exactly, apart from letter case. Nothing on this step recomputes the model, so to change its range, sill or nugget, go back to Variography or choose Fit a model here. The model must be fitted on the variable you are kriging.
Where next
Section titled “Where next”- Fit and save a variogram on its own: Variography.
- Run the full path from import to result: Quickstart.