The workspace
Find your way around the Vesta Online workspace: the left rail, workspace tabs, the Grid, Focus and Compare layouts, a panel's menu, the time slider and the status bar.
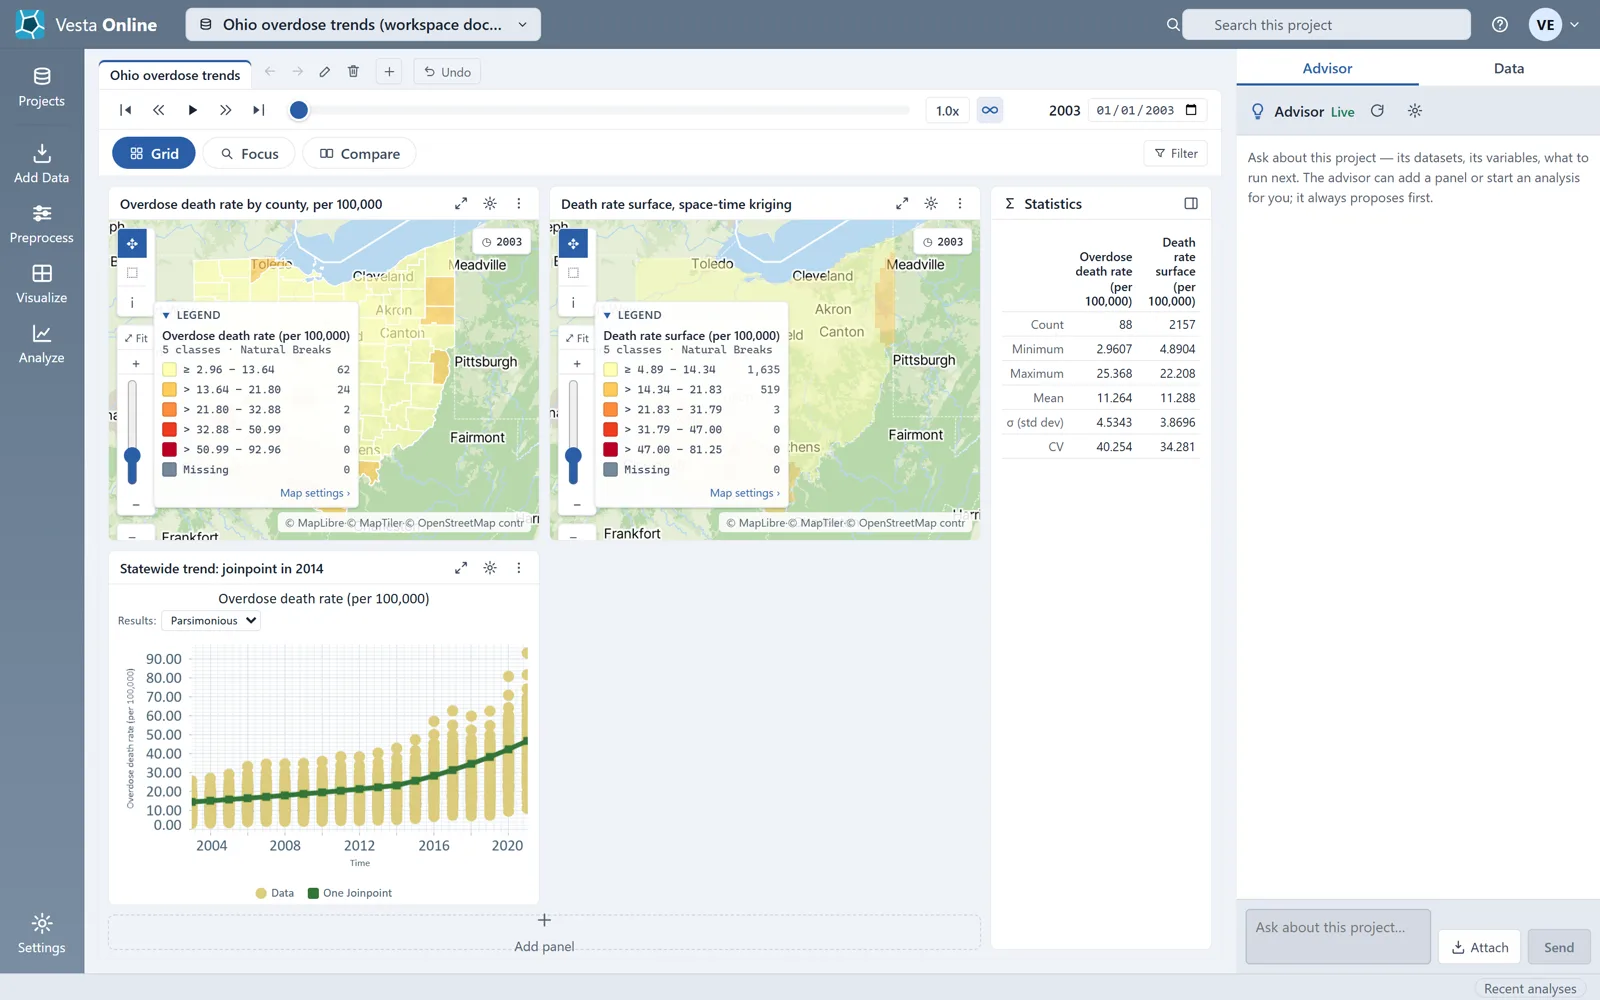
The workspace is where a project’s maps, charts and tables sit side by side. This article walks through it on a copy of the Ohio overdose trends sample project, which has four panels and an animated 2003 to 2021 county map. Every step below was run on Vesta Online, and the screenshots come from that run. The buttons for changing a workspace only show on a project you own, so the walk used a copy rather than the sample itself.
Take a tour
Section titled “Take a tour”- Open a workspaceOpen a project from the Projects page. Its first workspace opens at an address of the form /p/{project}/w/{number}, so a link to a workspace keeps working. The left rail lists Projects, Add Data, Preprocess, Visualize and Analyze, with Settings at the foot. Above the panels are the workspace tabs, then the time slider and the layout buttons Grid, Focus and Compare. The panels fill the middle, the Statistics panel sits to their right and the side pane is at the far right.
- Step the time sliderA workspace whose data has more than one time step shows the time slider above the layout buttons. From left to right it has Jump to start, Step back, Play, Step forward and Jump to end, the slider itself (Time step), the playback speed button (1.0x to start), the loop button (Looping is on to start), the current time and a date picker (Jump to a date). Choose Step forward: the label moves from 2003 to 2004, the clock on each map follows, and the Statistics panel recalculates for the new time step.
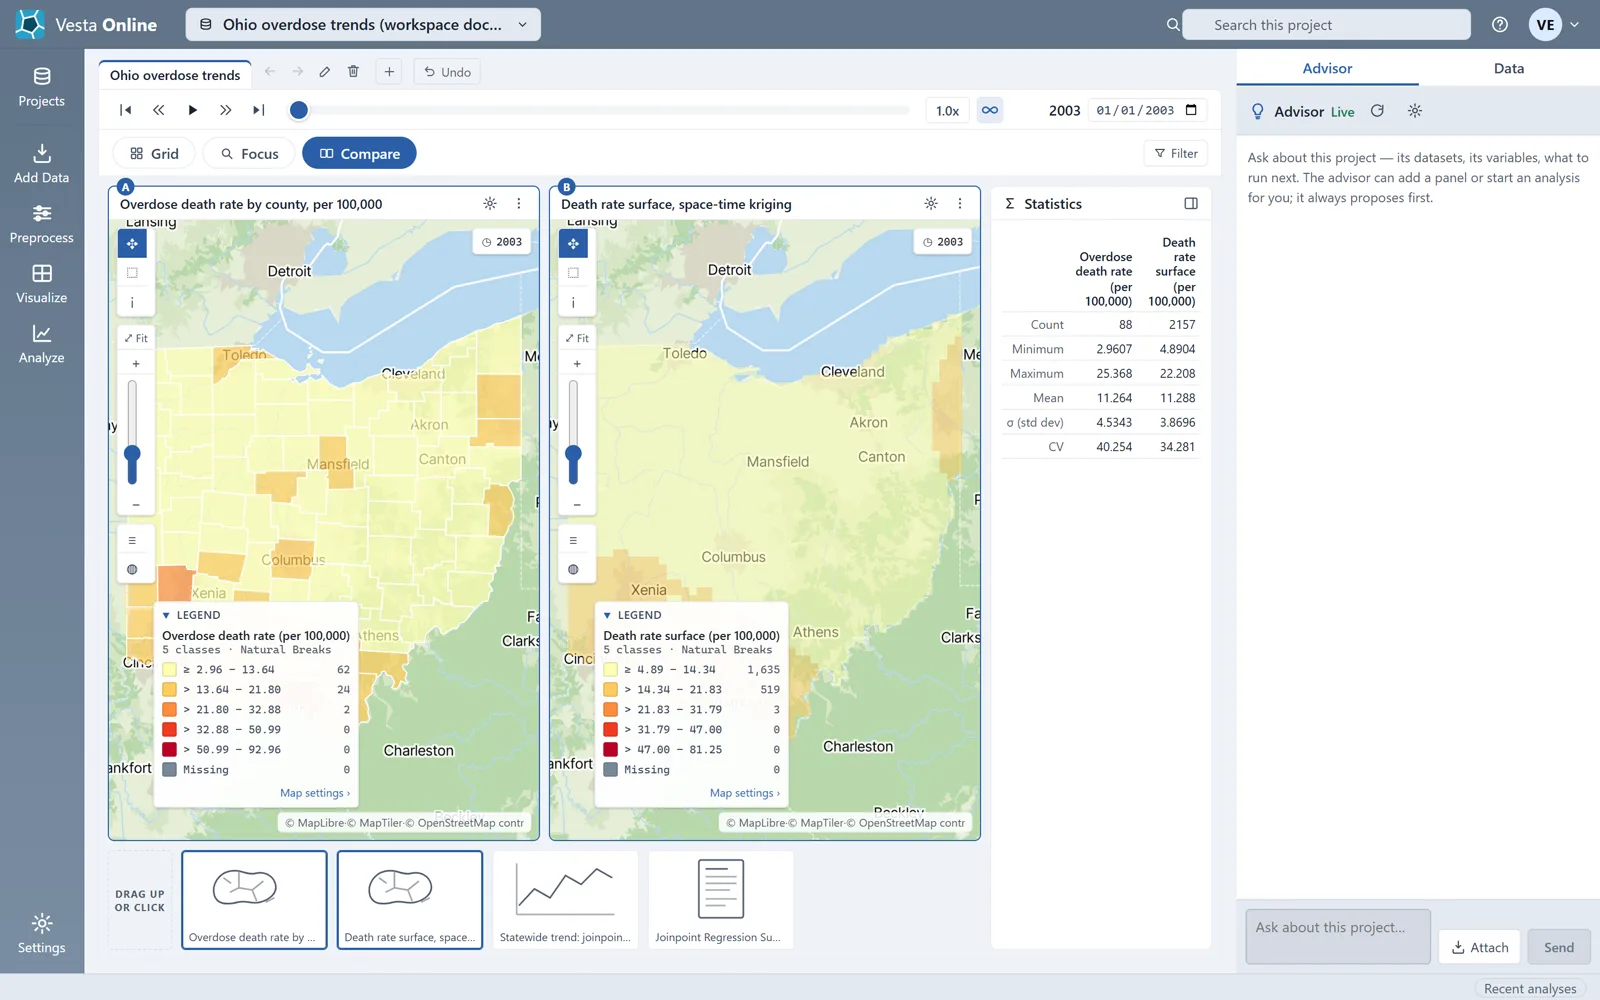
- Choose a layoutGrid, Focus and Compare change how the panels are arranged. Choose Focus to see one panel large, with the others as small tiles under it labeled Click to focus. Choose Compare to see two panels side by side, marked A and B, with the rest under a strip labeled Drag up or click. Choose Grid to go back to every panel at once.
- Reload the pageThe layout you chose is saved with the workspace. Choose Focus, reload the page, and the workspace opens in Focus again, with one panel large and the others in the strip. Which panel is the large one is not saved, so it can differ after a reload.
- Use a panel's menuEach panel has a title and a row of buttons: Focus this visualization, Visualization settings (the gear) and Panel actions (three dots). Panel actions lists Export, Rename panel…, Move left, Move right and Remove panel. Export saves what the panel shows. Move left is off on the first panel and Move right is off on the last. Move right swaps the panel with the one after it, and an Undo button appears beside the tabs. Remove panel asks you to confirm: tick I understand this removes the visualization from this workspace. and choose Remove panel. The data the panel read is not touched, and Undo brings the panel back while you stay on the page.
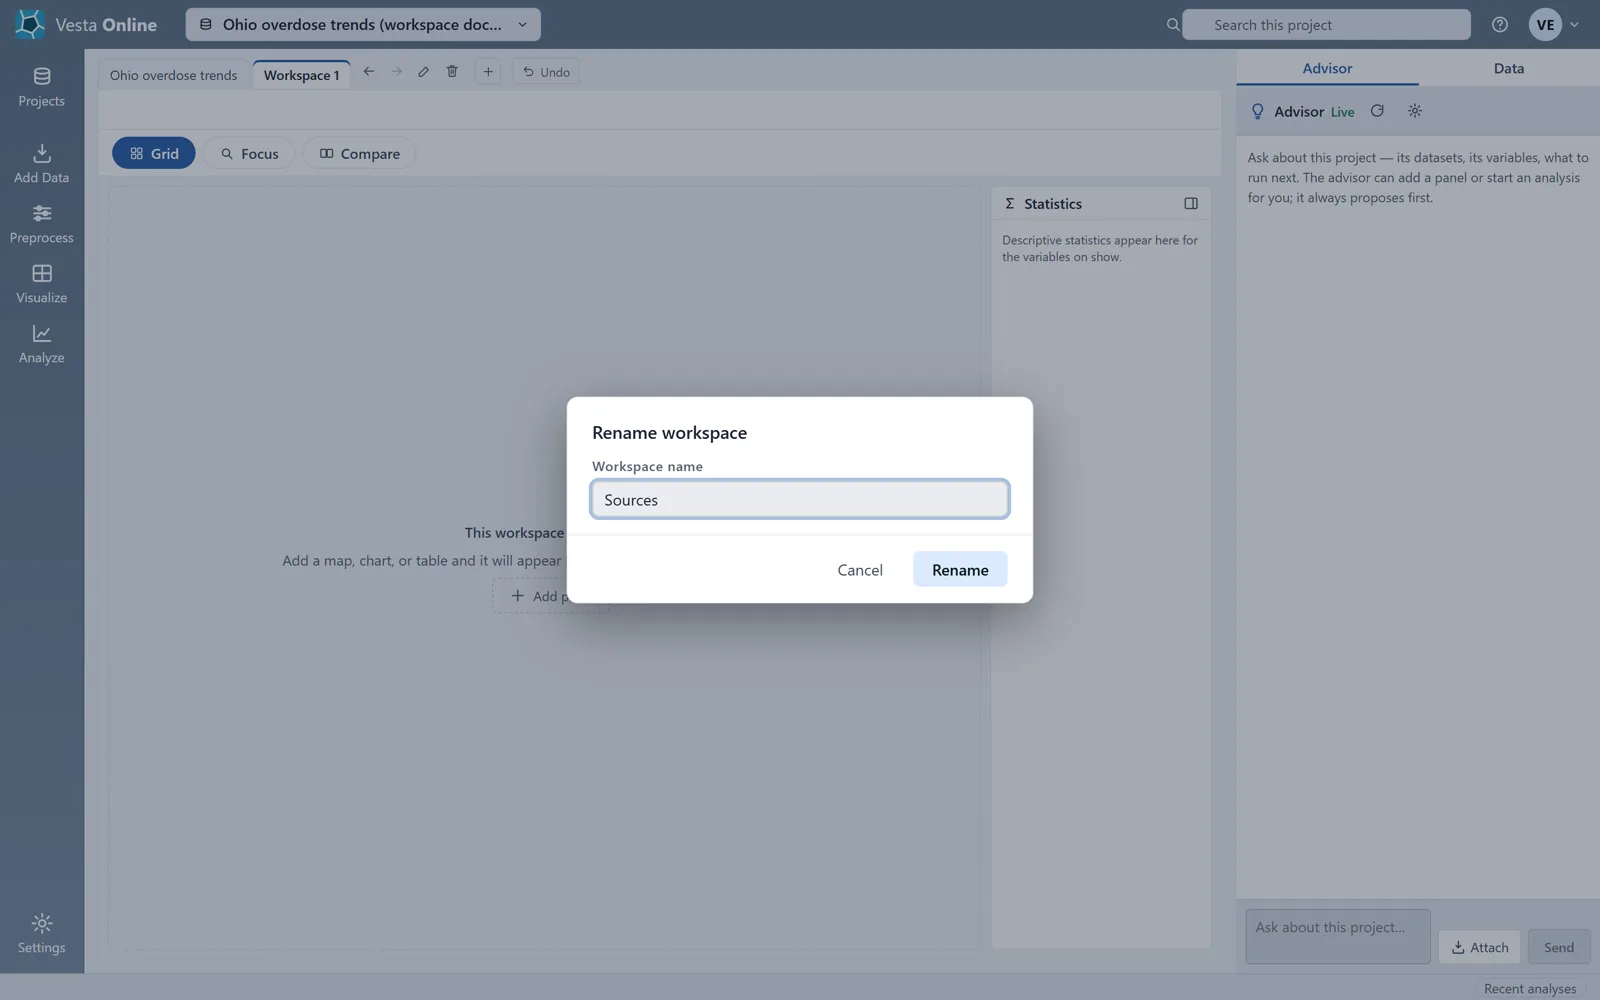
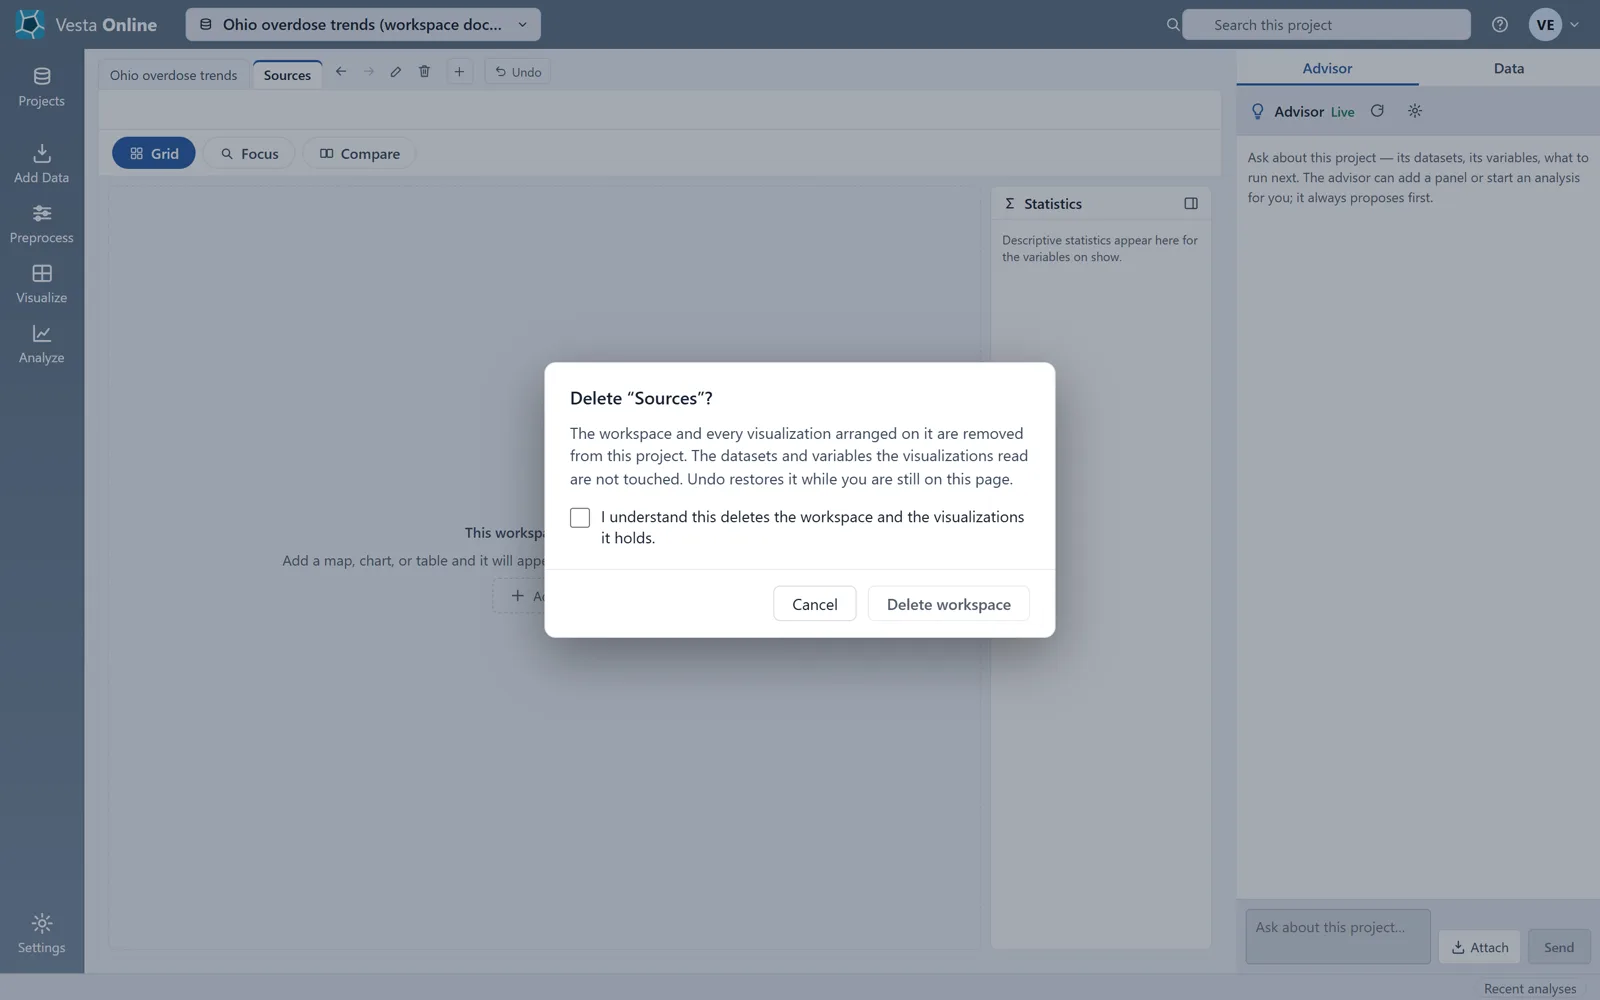
- Add and manage workspacesChoose the + beside the tabs for a new workspace; it is named Workspace 1, Workspace 2 and so on, and it opens with no panels in it: the area reads This workspace is empty, with an Add panel button and the line Add a map, chart, or table and it will appear here alongside anything else you add. The tab you are on has four small buttons: Move this workspace left, Move this workspace right, Rename this workspace and Delete this workspace. Rename opens a Rename workspace box with a Workspace name field. Delete asks you to tick I understand this deletes the workspace and the visualizations it holds. before Delete workspace. Deleting a workspace removes the panels arranged on it, not the datasets and variables they read.
- Read the status bar and side paneThe status bar runs along the bottom. Its right end has the Recent analyses button. Its left end is empty with the Advisor tab open. With the Data tab open it read the dataset's name, its number of objects and its number of times, here Ohio counties · 88 objects · 19 times. The side pane has two tabs, Advisor and Data. Data lists the project's dataset, variables, results and models, with a card for the selection below.
What you should see
Section titled “What you should see”The workspace
Section titled “The workspace”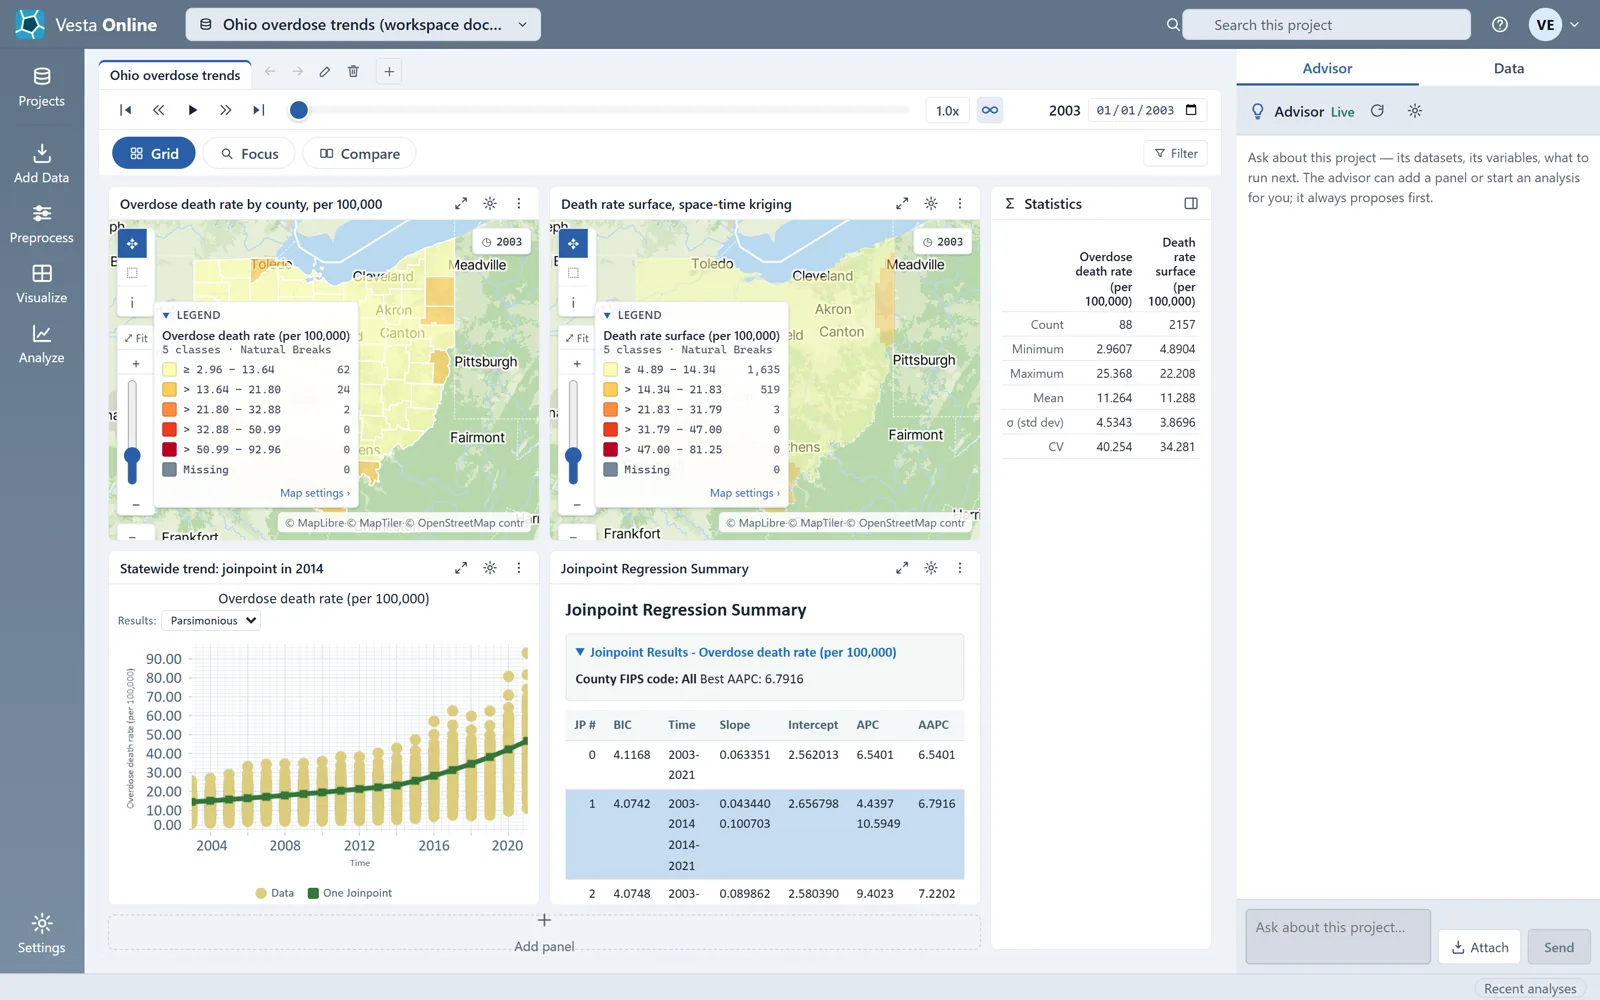
Stepping the time slider
Section titled “Stepping the time slider”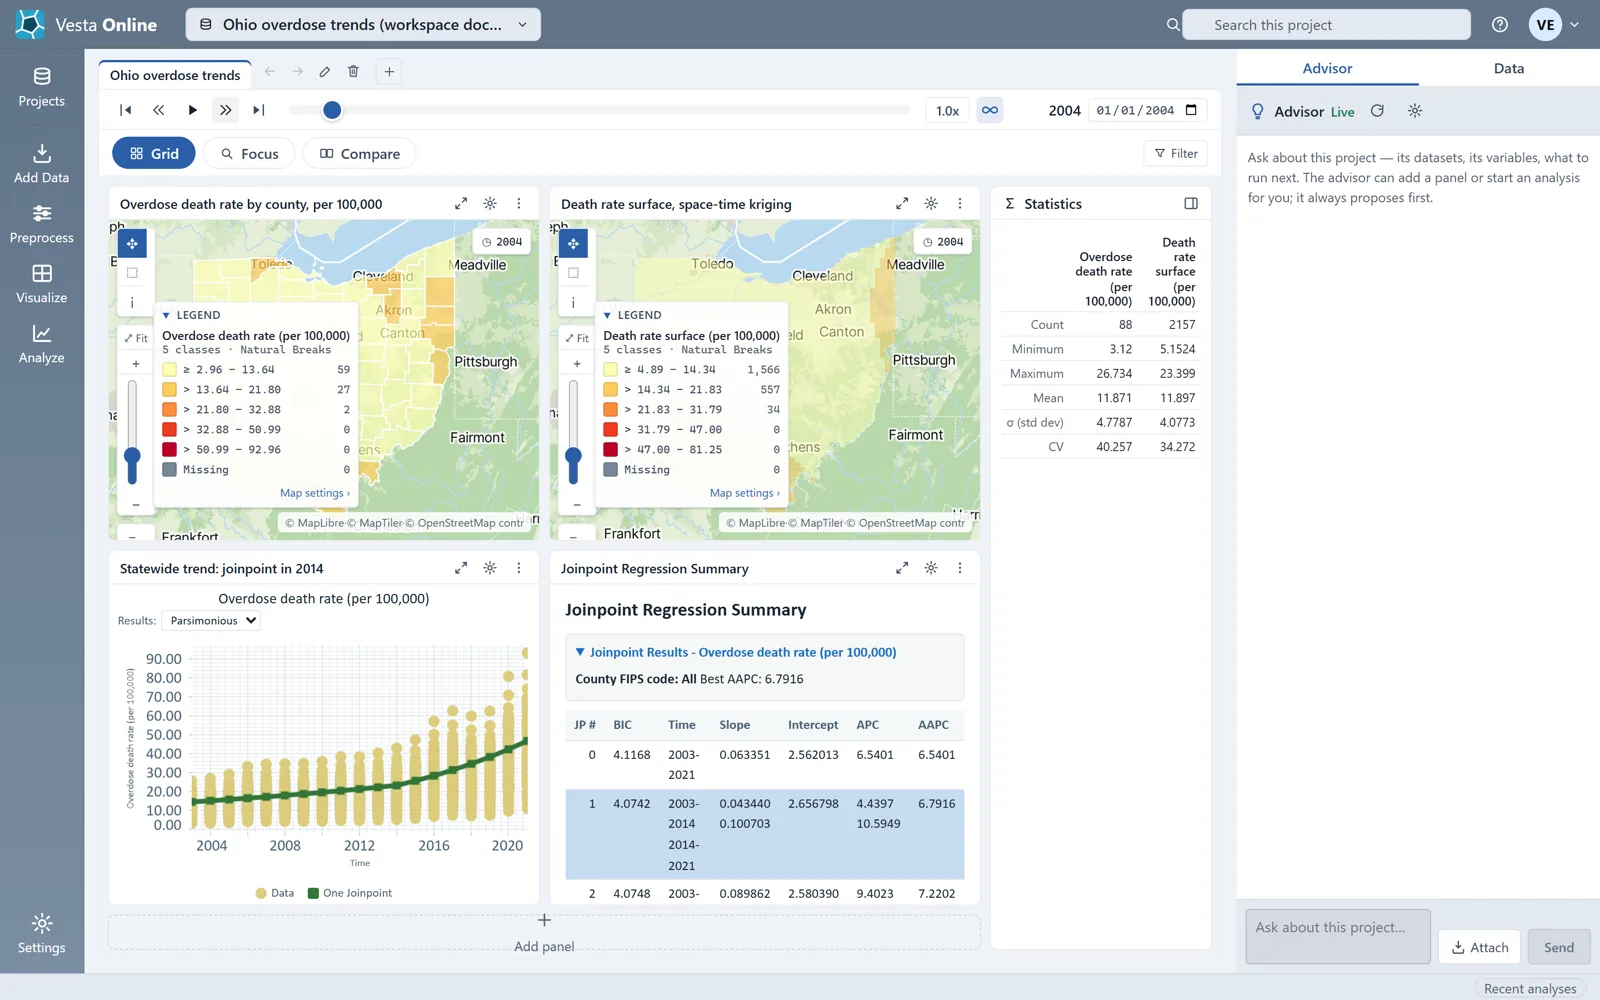
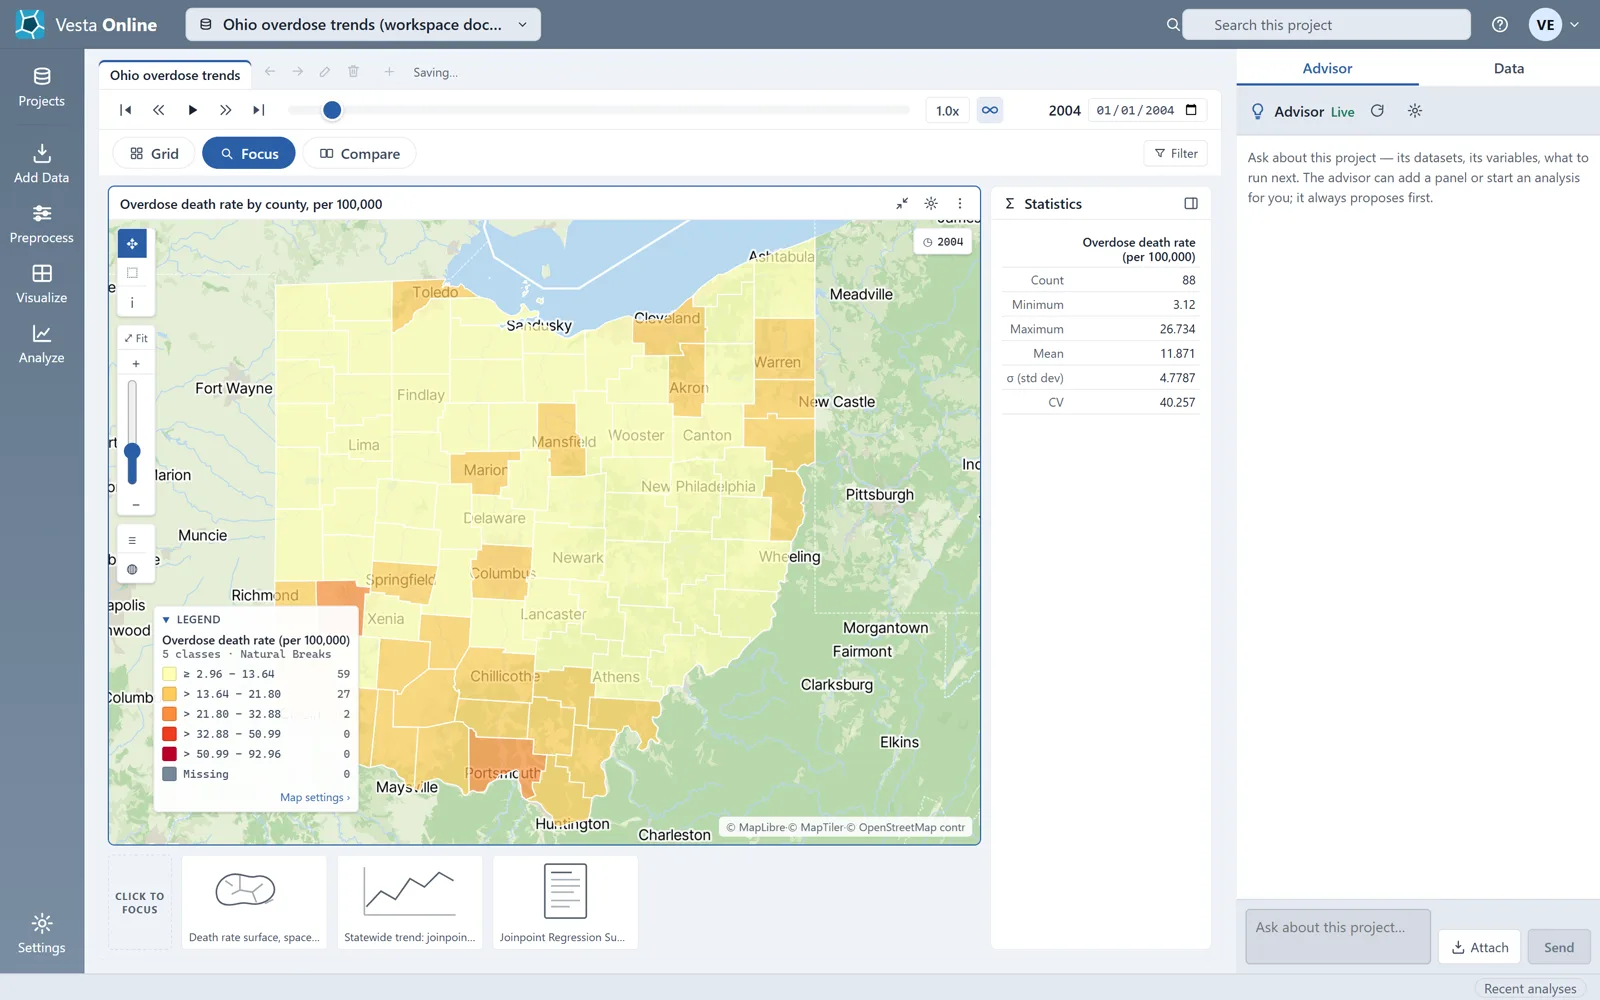
Compare
Section titled “Compare”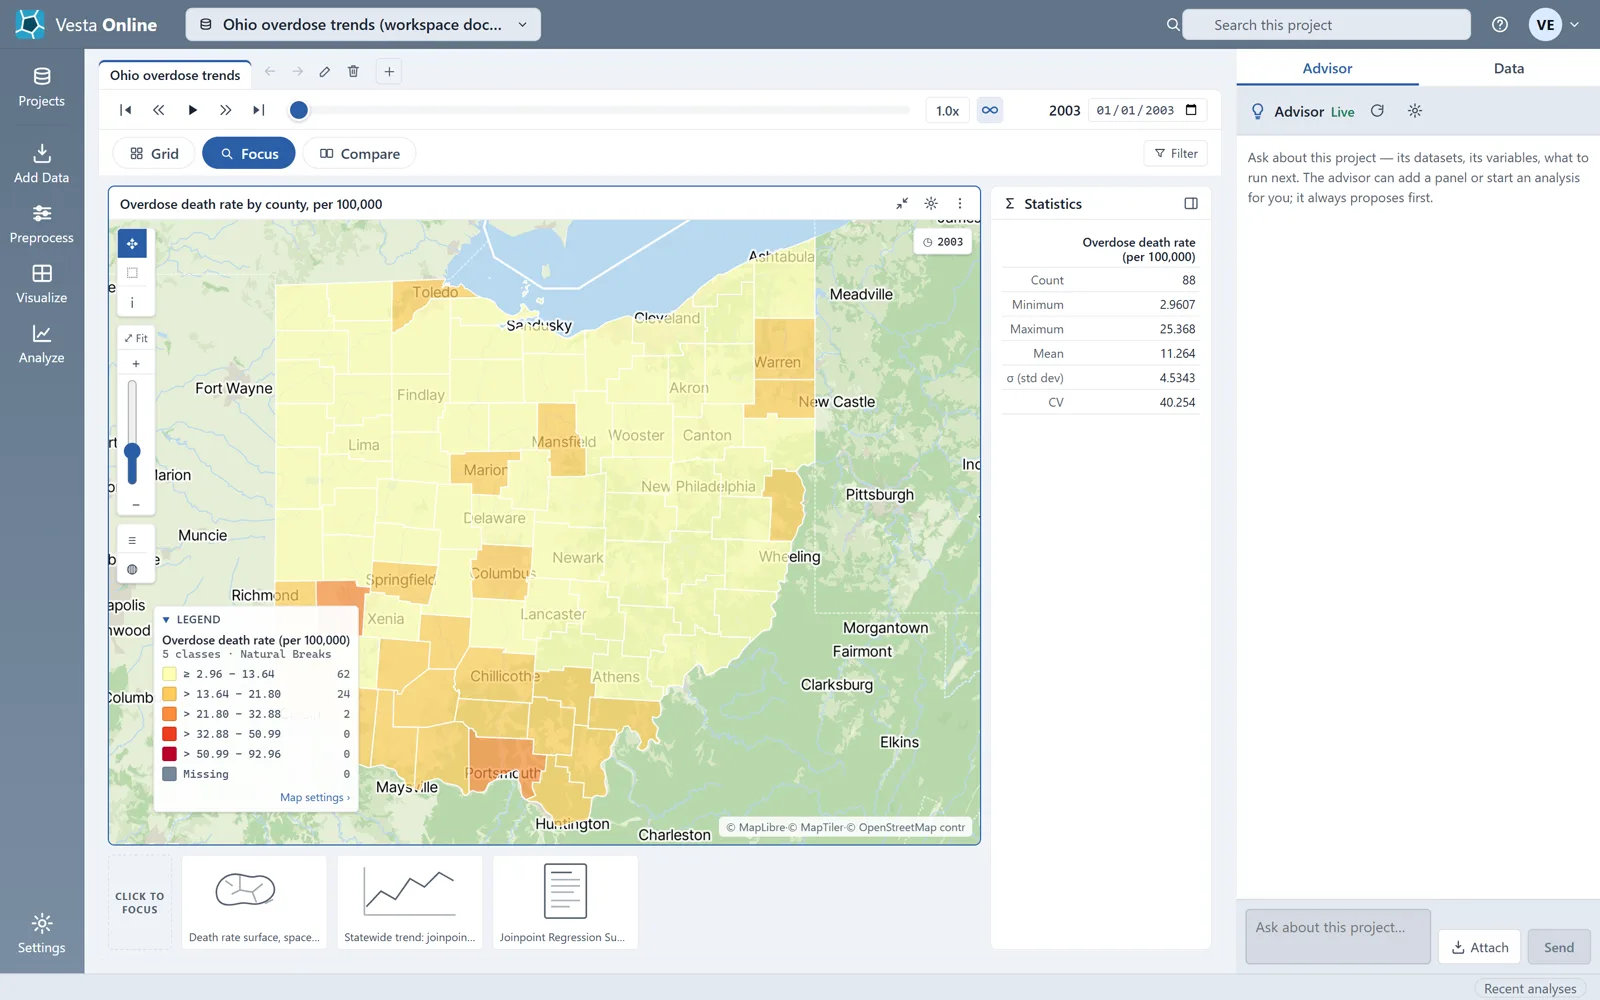
A panel’s menu
Section titled “A panel’s menu”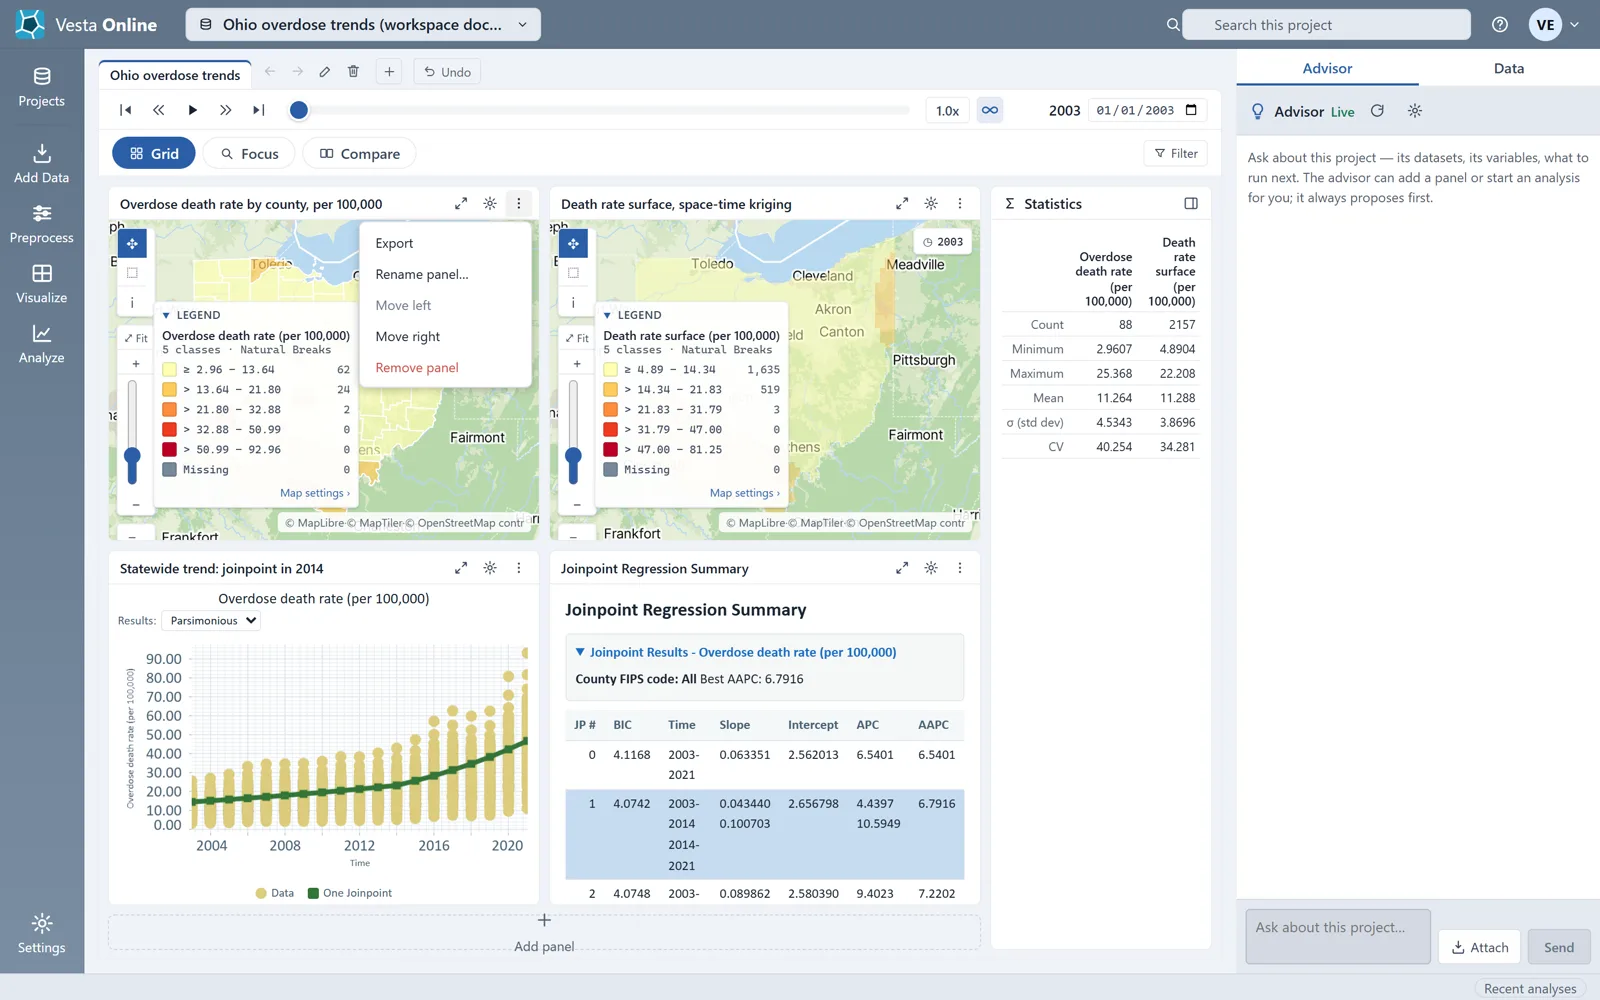
After Move right
Section titled “After Move right”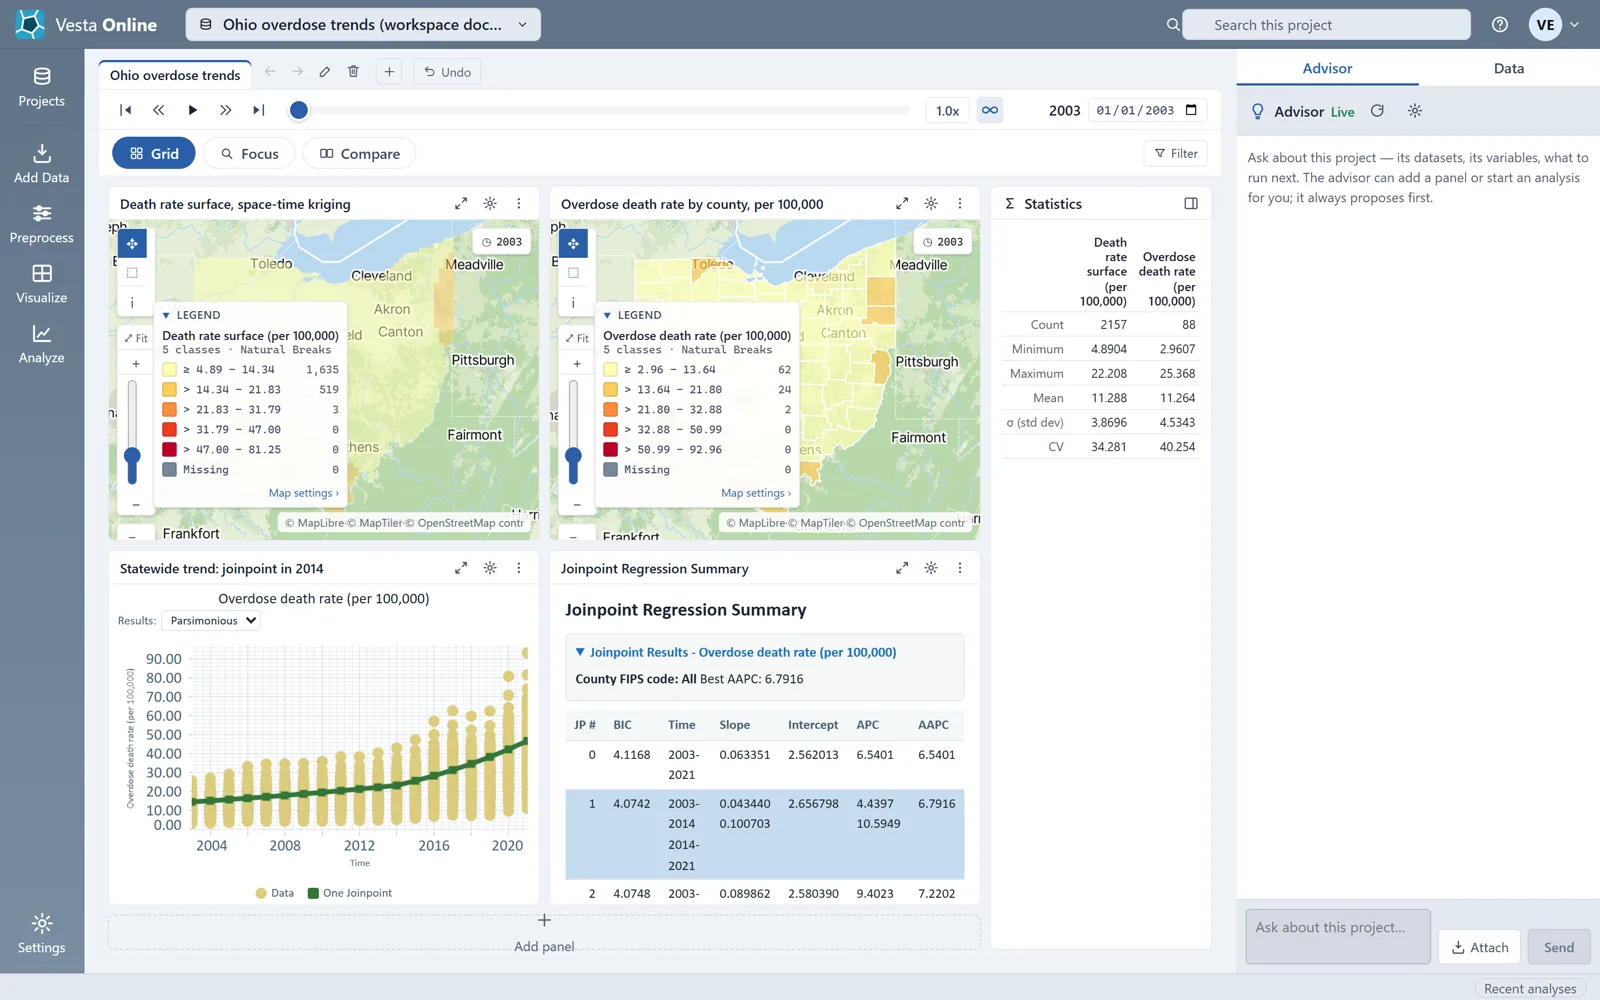
Removing a panel
Section titled “Removing a panel”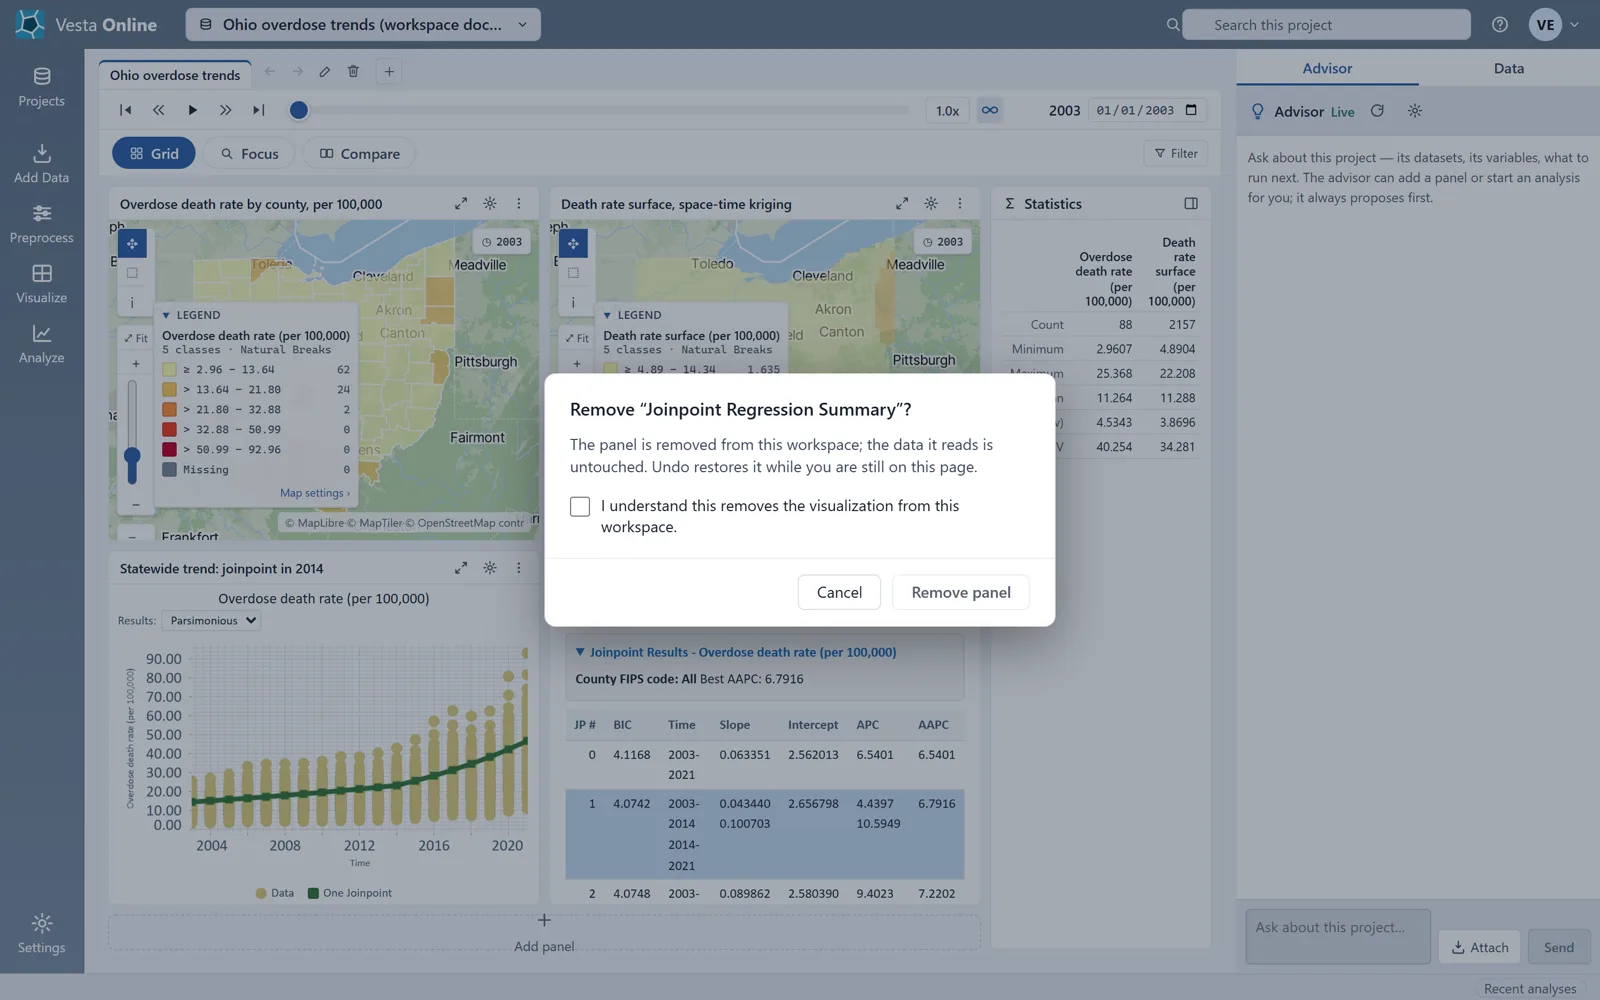
Renaming and deleting
Section titled “Renaming and deleting”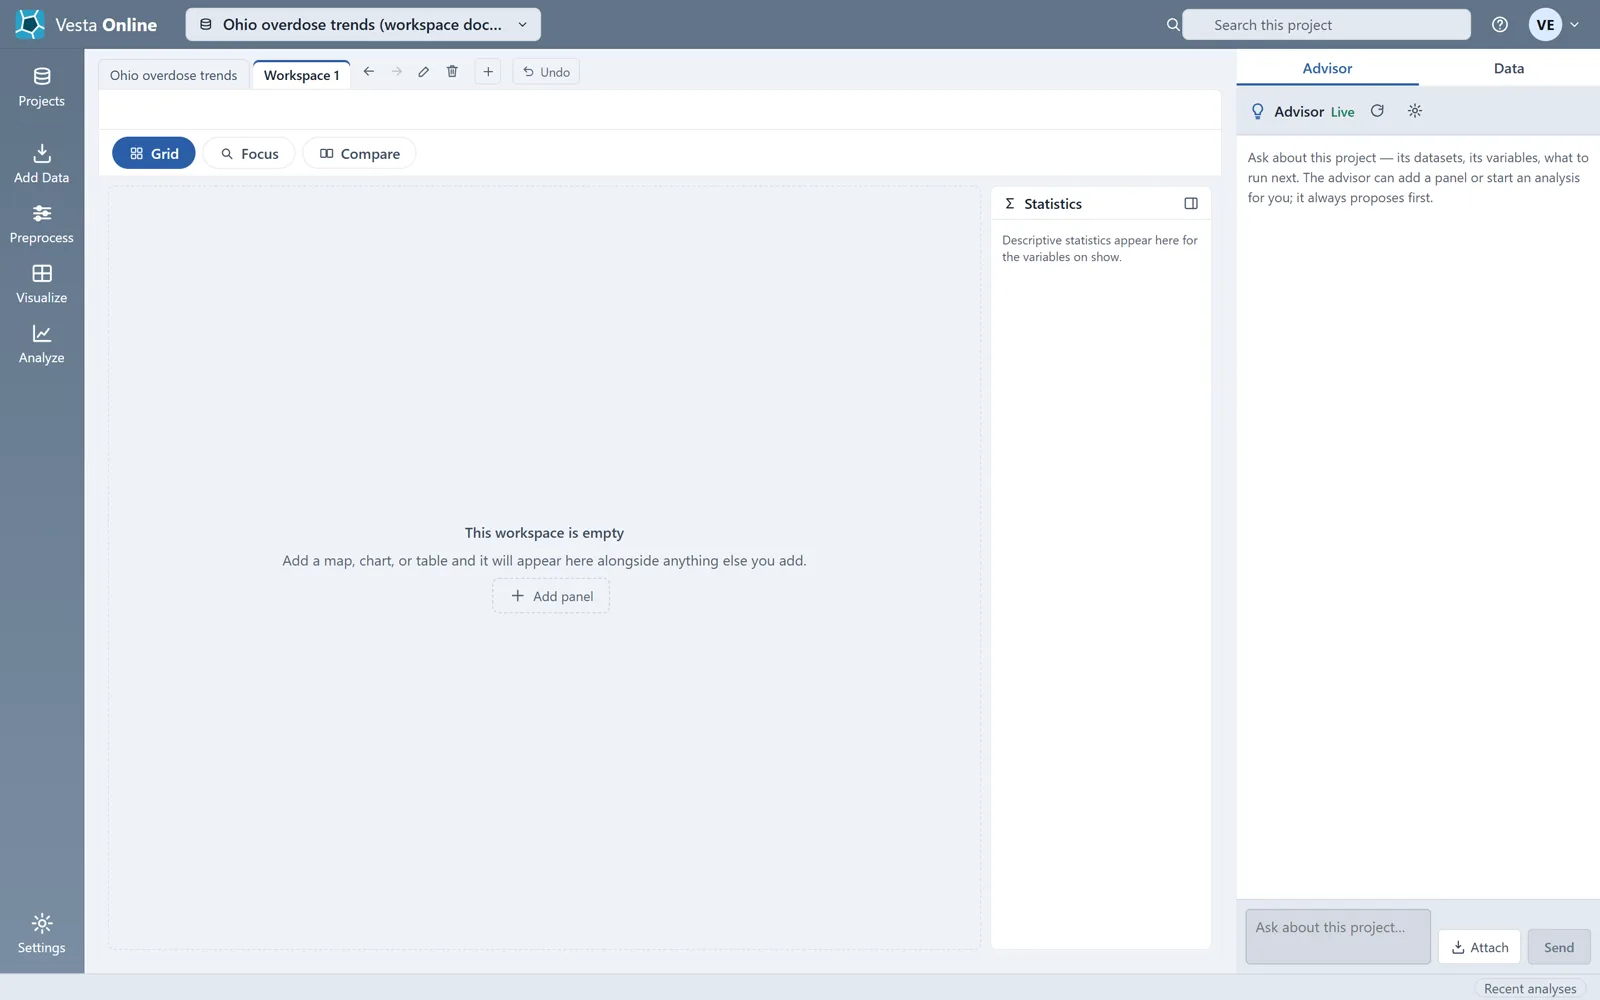
The status bar and the Data tab
Section titled “The status bar and the Data tab”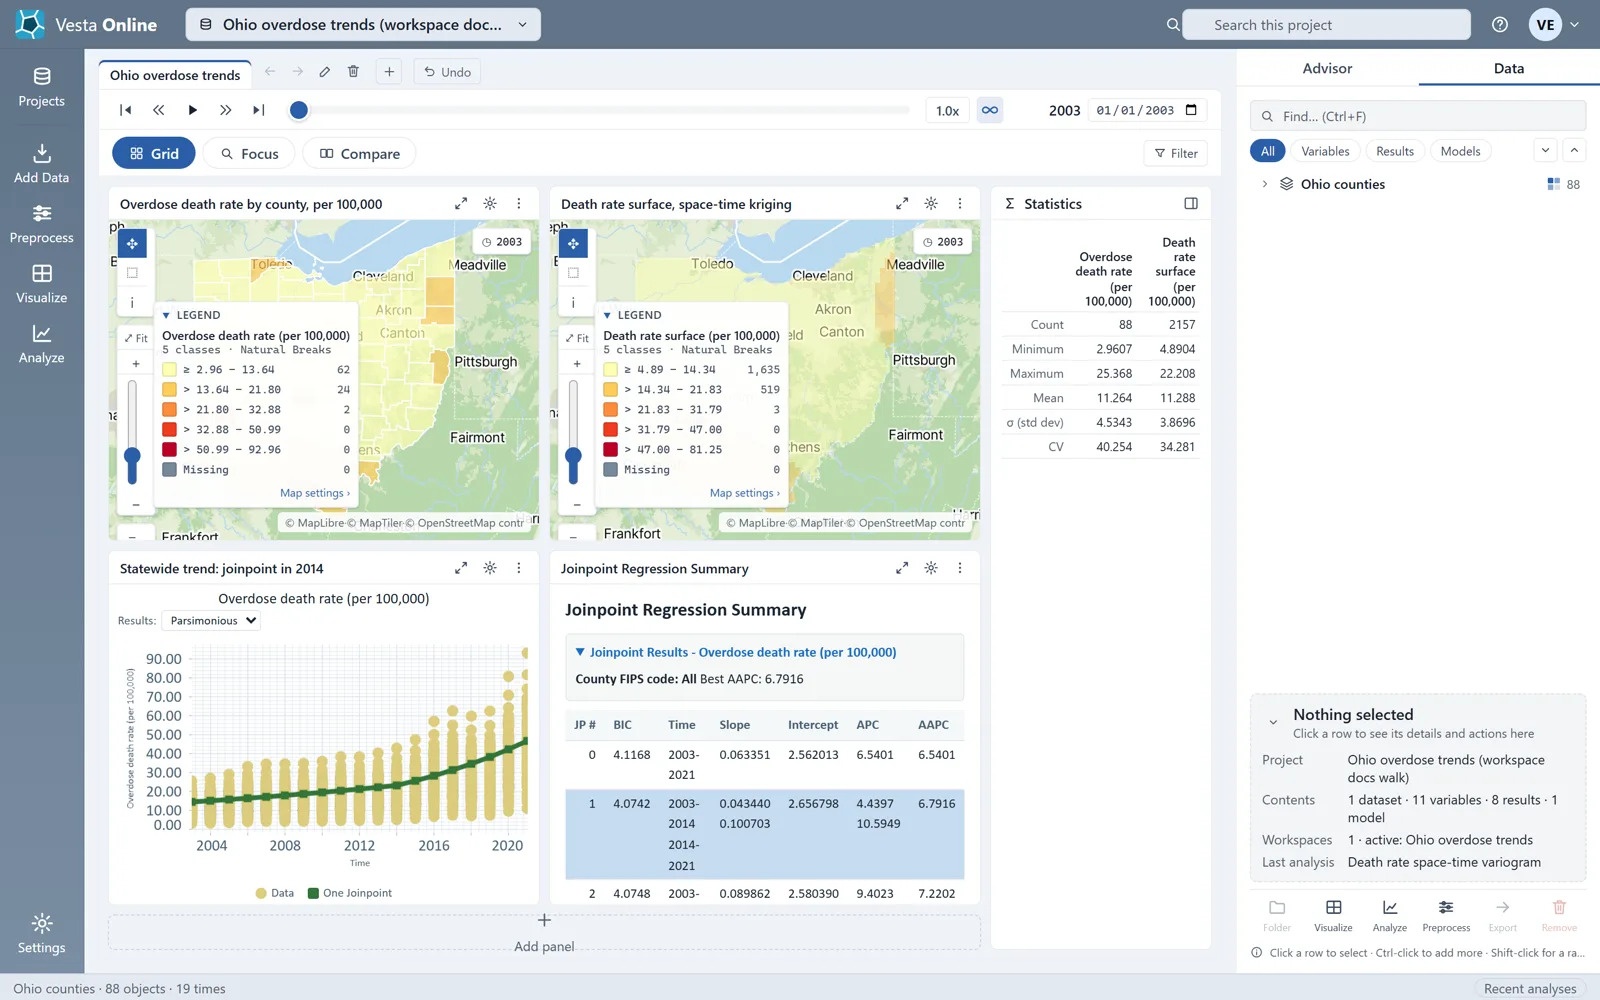
What each layout does
Section titled “What each layout does”| Layout | What you see | Notes |
|---|---|---|
| Grid | Every panel at once. | One panel fills the width; two or more use two columns, with more rows as panels are added. |
| Focus | One panel large, the others in a strip. | The other panels wait in a strip labeled Click to focus. |
| Compare | Two panels side by side, marked A and B. | Needs at least two panels. With fewer, it is drawn as Grid. |
Four panels is the size the layouts are designed around, and Vesta Online does not stop you adding more. A panel header in Grid has Focus this visualization, and in Focus has Back to grid. The + Add panel button under the grid opens the Visualize hub to build the next panel.
The panels and the side pane
Section titled “The panels and the side pane”The Statistics panel on the right of the panels lists a count, minimum, maximum, mean, standard deviation and coefficient of variation for each variable on show, and follows the time slider. Collapse it with the button at its top right. Pressing Esc in the workspace clears the current selection.
The side pane’s Advisor tab is an optional AI-assisted guided workflow that helps you choose methods and interpret results; the statistical analyses run on Vesta’s own methods. Its own text says it can add a panel or start an analysis for you and always proposes first. Data visibility is off by default, so your data values are not sent to it; when you turn it on, the Advisor can also read summary statistics and analysis results from your project and look up values for specific places. The walk did not send it a message; see Using the Advisor. Drag the pane’s left edge to resize it.
Limits
Section titled “Limits”- Export is the first item of a panel’s menu and is on every panel; see Exporting data and pictures. The edit items only show on a project you own. Move left and Move right set the order of the panels. Focus and Compare pick which panels you see large.
- The buttons for changing a workspace (+, the tab buttons and Undo) only show on a project you own. A sample project opens read-only.
- Undo is offered while you stay on the page, as the Remove panel and Delete workspace dialogs say.
- Vesta Online needs a window at least 1,024 pixels wide. Below that width it shows a notice in place of the workspace.
Where next
Section titled “Where next”- Make maps for your workspace: Maps.
- Make charts: Charts.
- Link selections across panels: Linking and brushing.
- Save and share what you built: Exporting.