Linking and brushing
Select counties on a map, in a table or in a chart in Vesta Online and see the same objects highlighted in every other panel of the workspace.
Linking connects the panels of a workspace. When you select objects in one panel, the same objects are highlighted in the other panels that take part (see Limits). You can select on the map, in a table or in a chart. This is sometimes called brushing. This article uses a copy of the Diabetes and poverty sample with a map, a table, a scatterplot and a histogram of its 3,109 US counties. Every step below was run on Vesta Online, and the screenshots come from that run.
The selection belongs to one workspace tab. A second tab in the same project has its own selection: with 193 counties selected in this workspace, the first tab showed nothing selected. Panels link through the dataset they show: here the map, the table, the scatterplot and the histogram all read the US counties dataset.
Link a map, a table and charts
Section titled “Link a map, a table and charts”- Add a table and a chartOpen a workspace of a project you own, choose Add panel at the foot of the grid, and choose Create new. Add a Map, a Table, a Scatter Plot and a Histogram to the four slots. Pick Diagnosed diabetes (% of adults) for the map and the histogram, Diagnosed diabetes and Poverty rate (% of people) for the scatterplot, and the US counties dataset for the table. Choose Create workspace. The new workspace opens as its own tab, and every panel reads the same 3,109 counties.
- Choose the Select toolA new map opens on the Pan tool, which only moves the map. Choose the Select tool in the map's left rail (the dashed box). Its tooltip reads "Select — click a feature, or drag a box; hold Shift to add".
- Select counties on the mapDrag a box over part of the map. The counties inside the box are selected: the same counties are highlighted in the scatterplot and the histogram, their rows are shaded in the table, and the map legend gains a Selected row with the count. Here the box caught 221 counties.
- Read the Selected groupThe Statistics panel keeps its all-counties rows and adds a Selected (n) group below them that repeats the same measures for just the selected counties. The group reads Selected (221), the table footer reads "221 selected" and the legend row reads 221: the three counts agree.
- Select in a chartDrag a box around the points at the right of the scatterplot, where the diabetes rate (the horizontal axis) is highest. The new selection replaces the one the map made: here 193 counties whose diabetes rates run from 17.9 to 24.1 percent, against a mean of 13.5 for all 3,109 counties. The map, the table, the histogram and the Selected group follow at once.
- Clear on the mapWith the Select tool chosen, click on empty map, away from any county. The selection is cleared in every panel: the legend row, the table footer and the Selected group disappear.
- Clear the selectionA press on empty space inside the scatterplot, with no drag, clears the selection the same way. Select in the scatterplot again, press on an empty part of the plot, and the legend row, the table footer and the Selected group disappear.
What you should see
Section titled “What you should see”The workspace
Section titled “The workspace”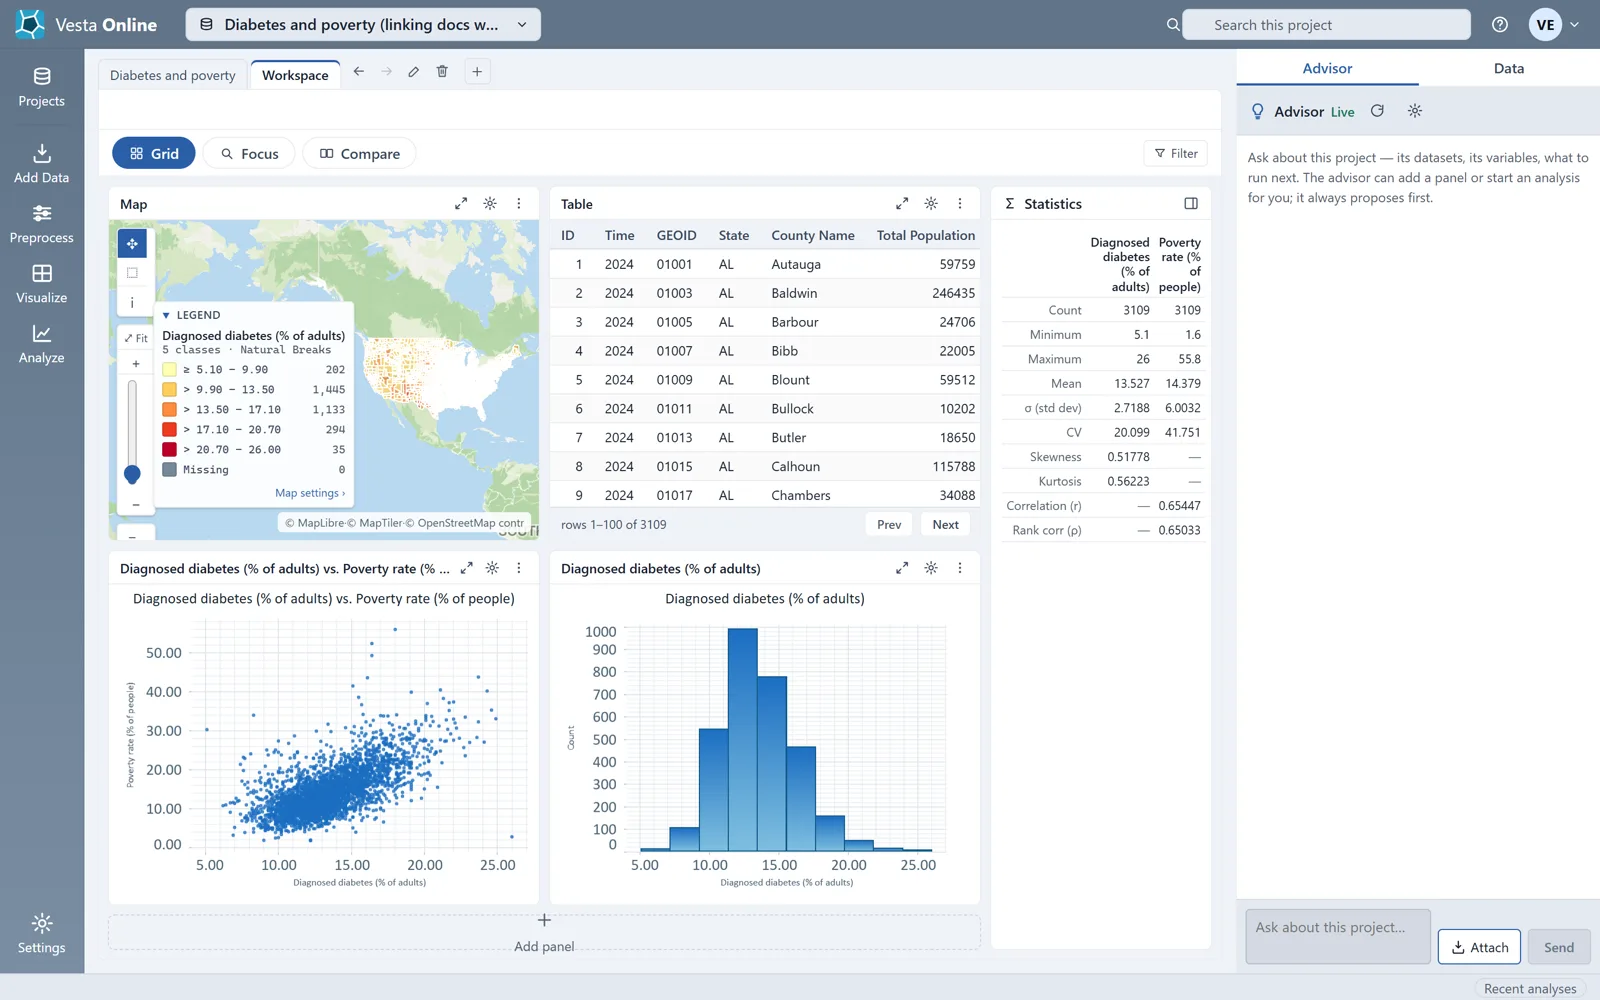
The Select tool
Section titled “The Select tool”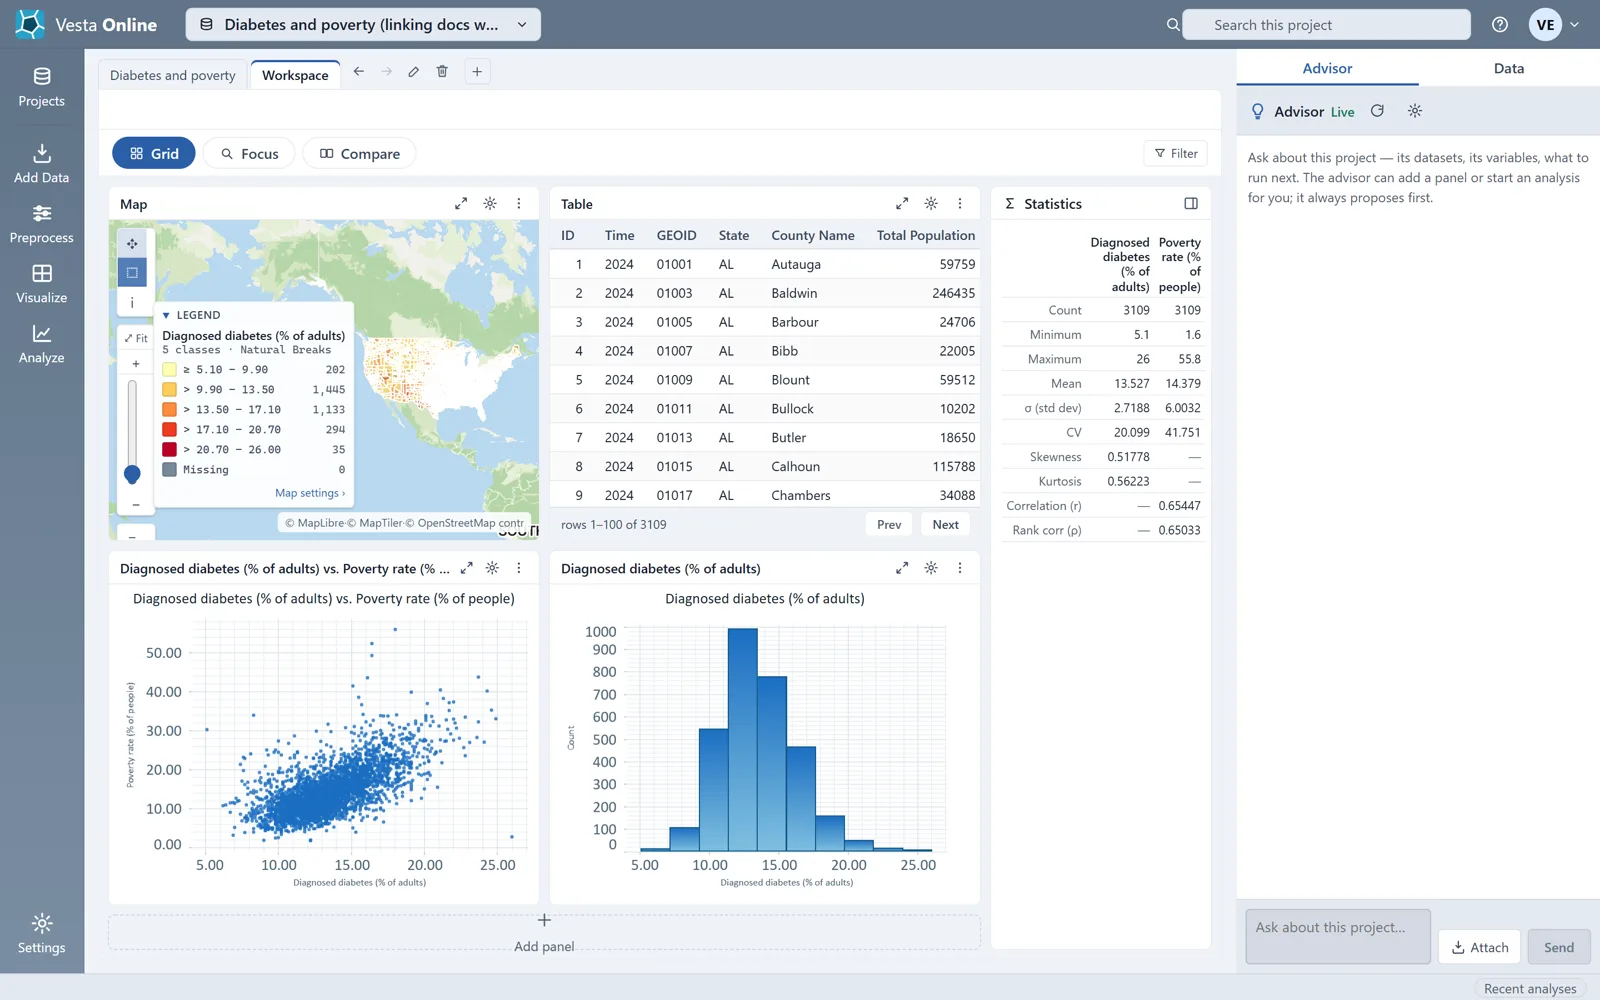
A selection made on the map
Section titled “A selection made on the map”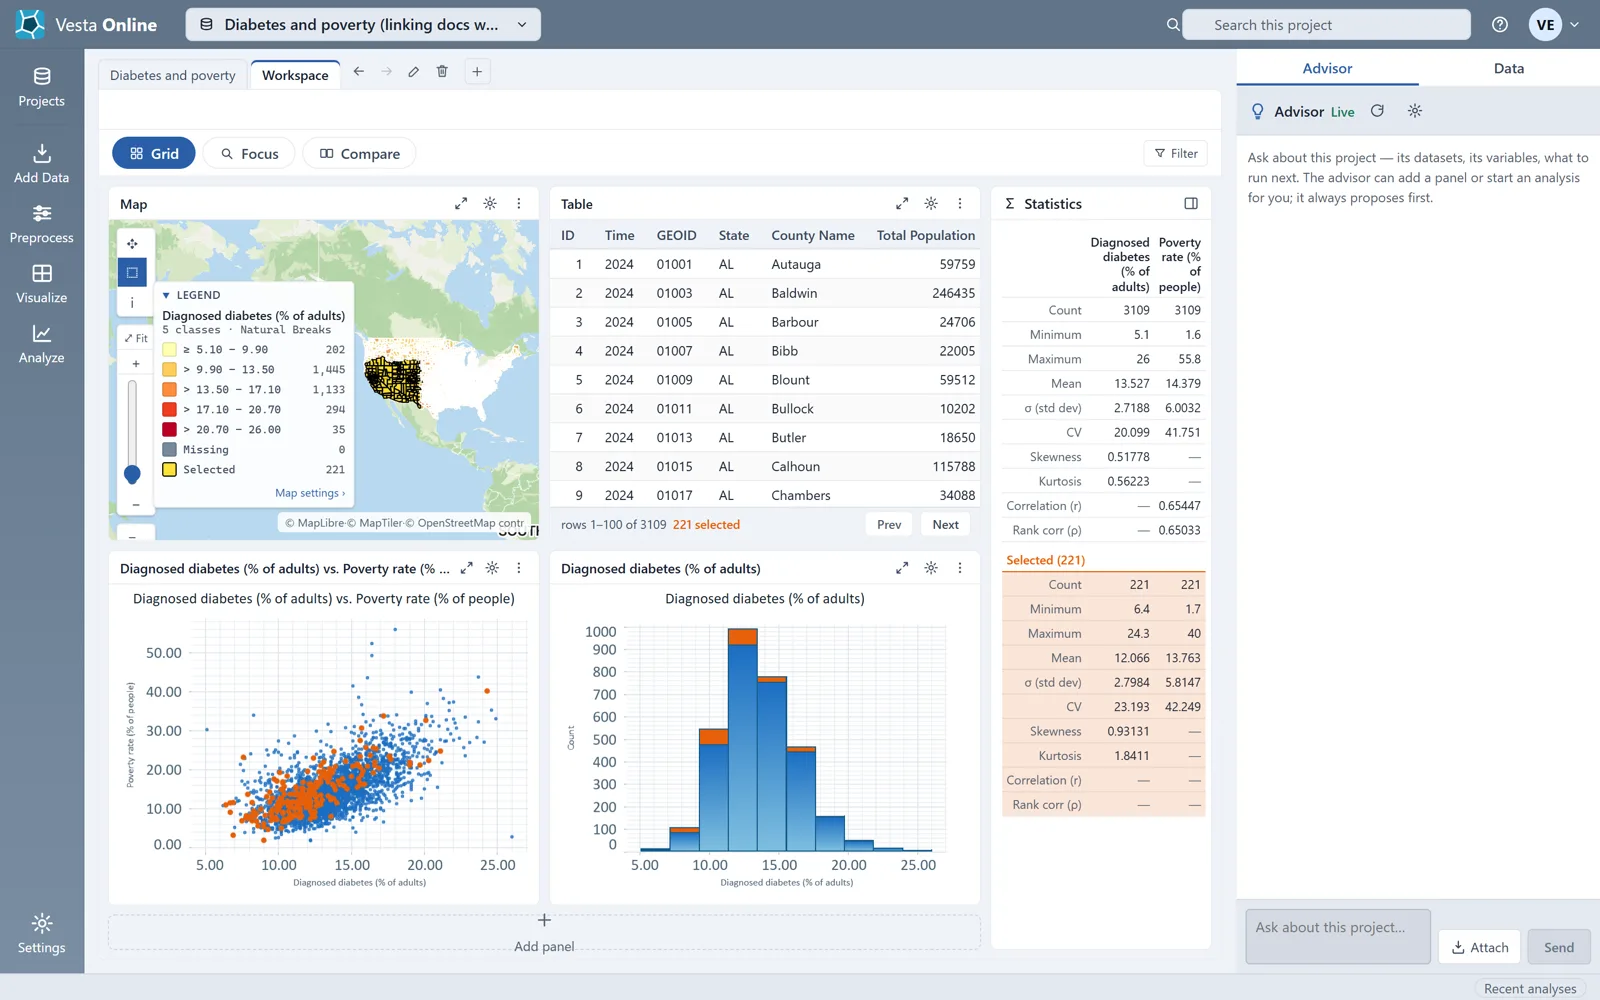
The Selected group
Section titled “The Selected group”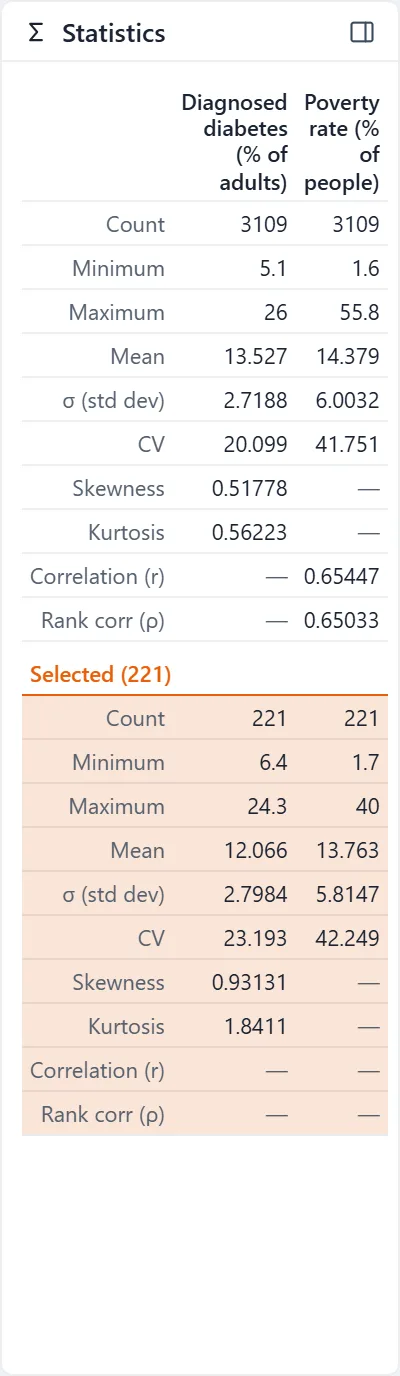
A selection made in a chart
Section titled “A selection made in a chart”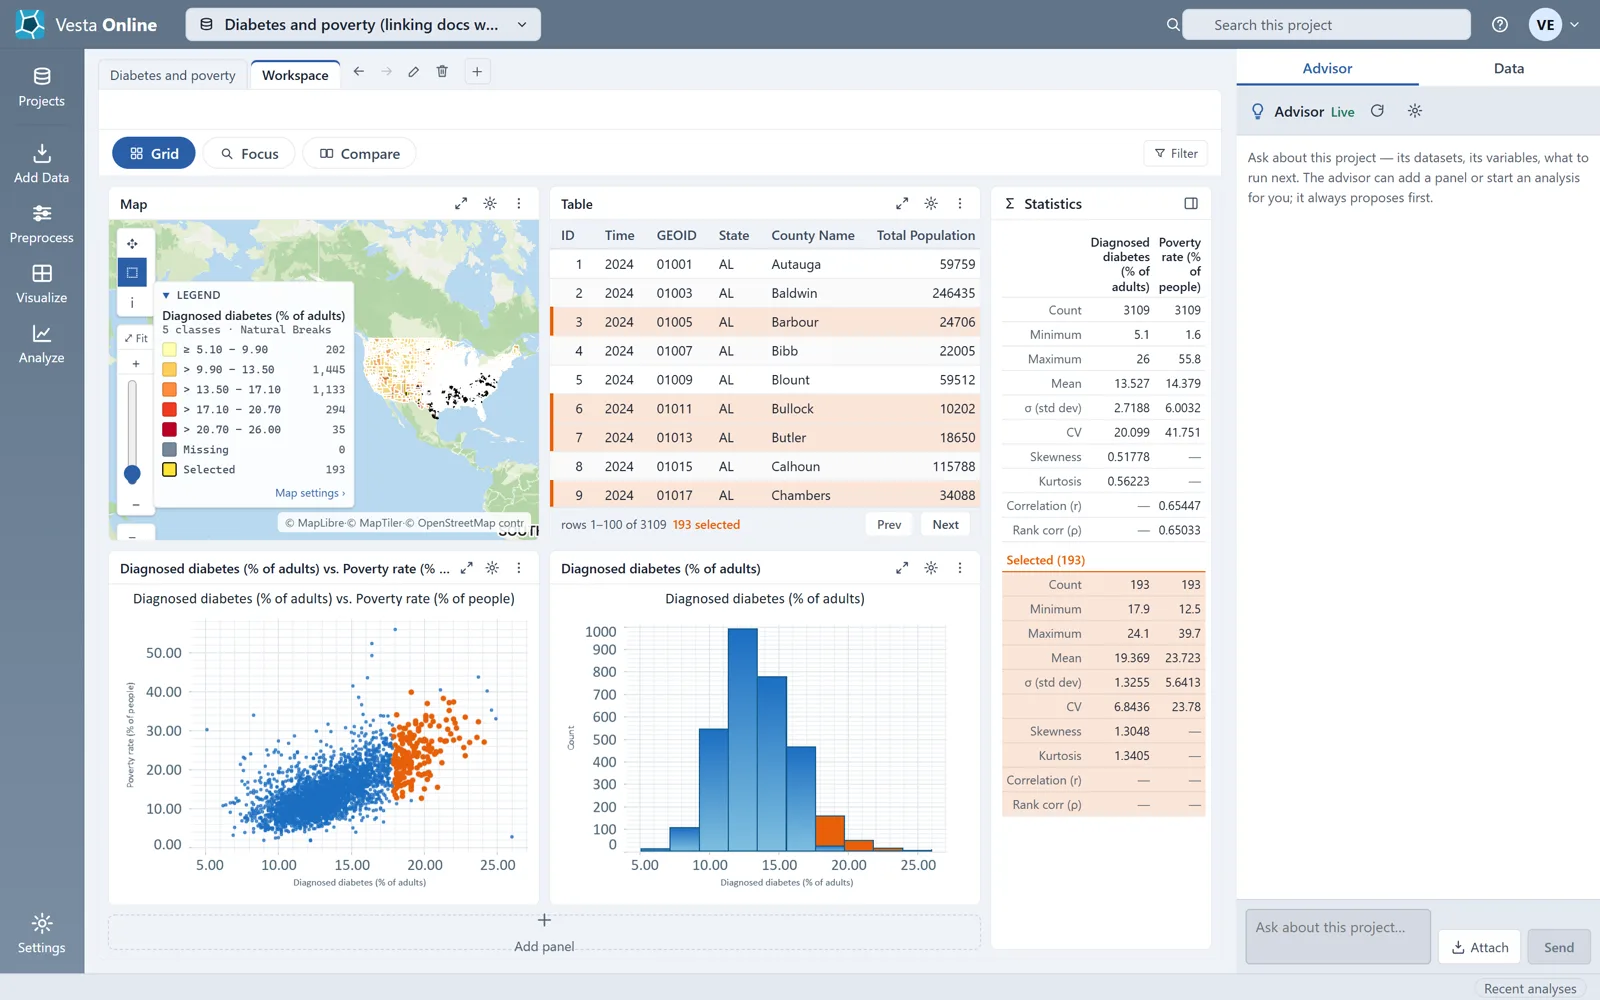
Cleared from the map
Section titled “Cleared from the map”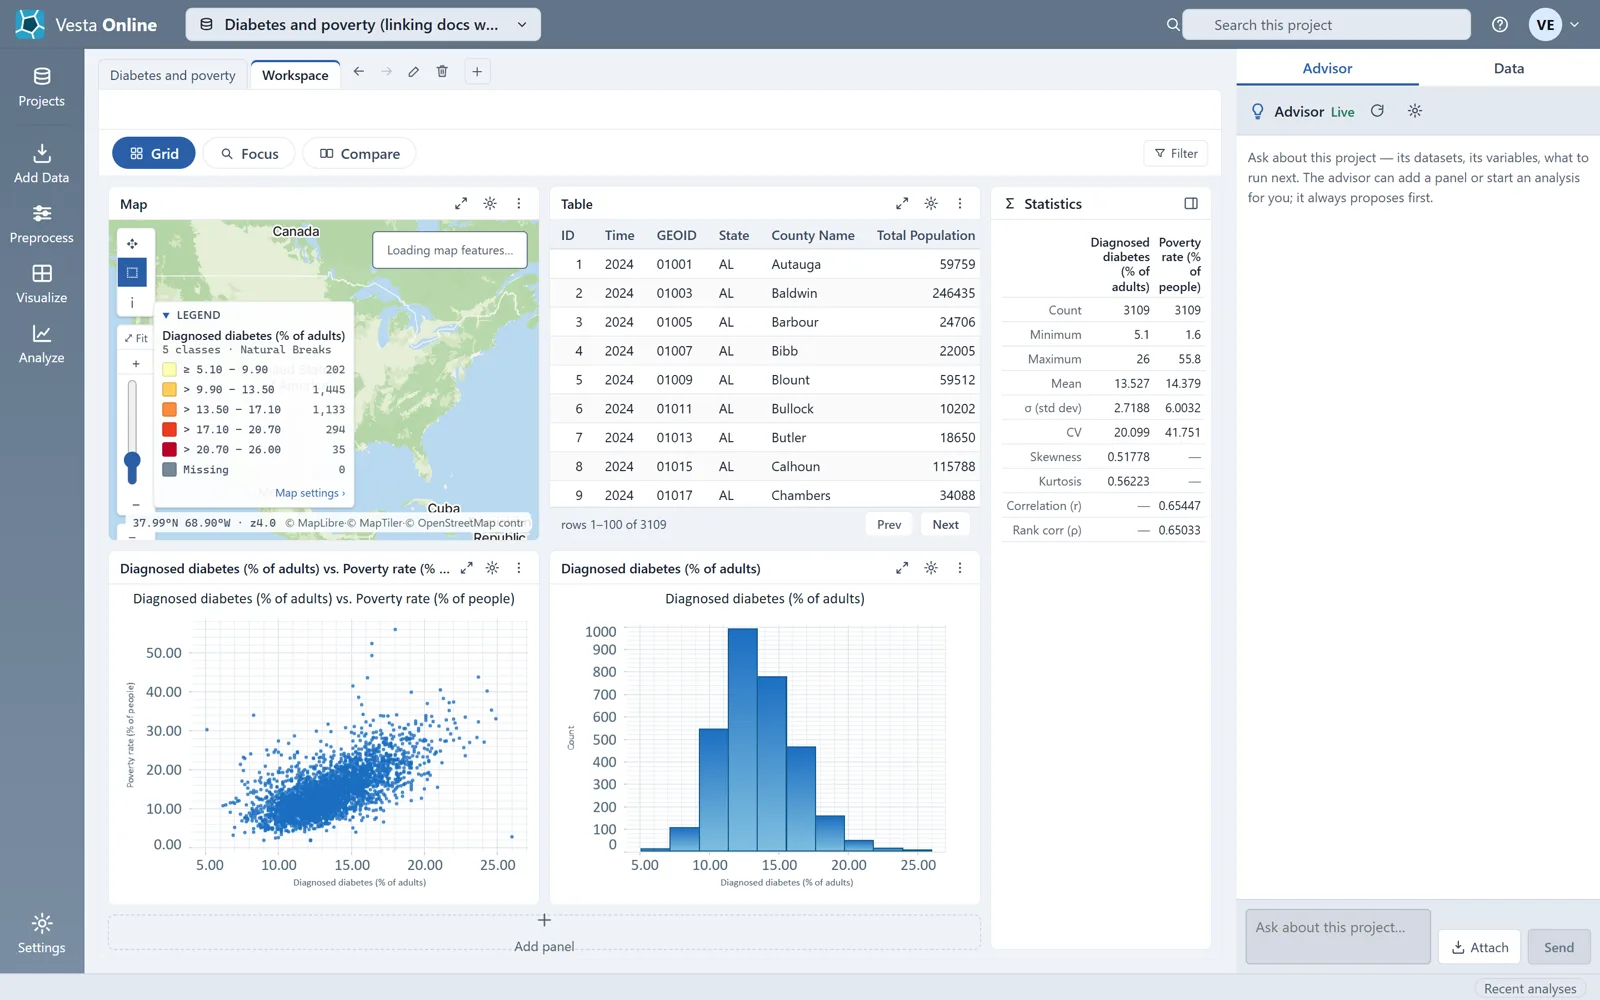
Cleared from a chart
Section titled “Cleared from a chart”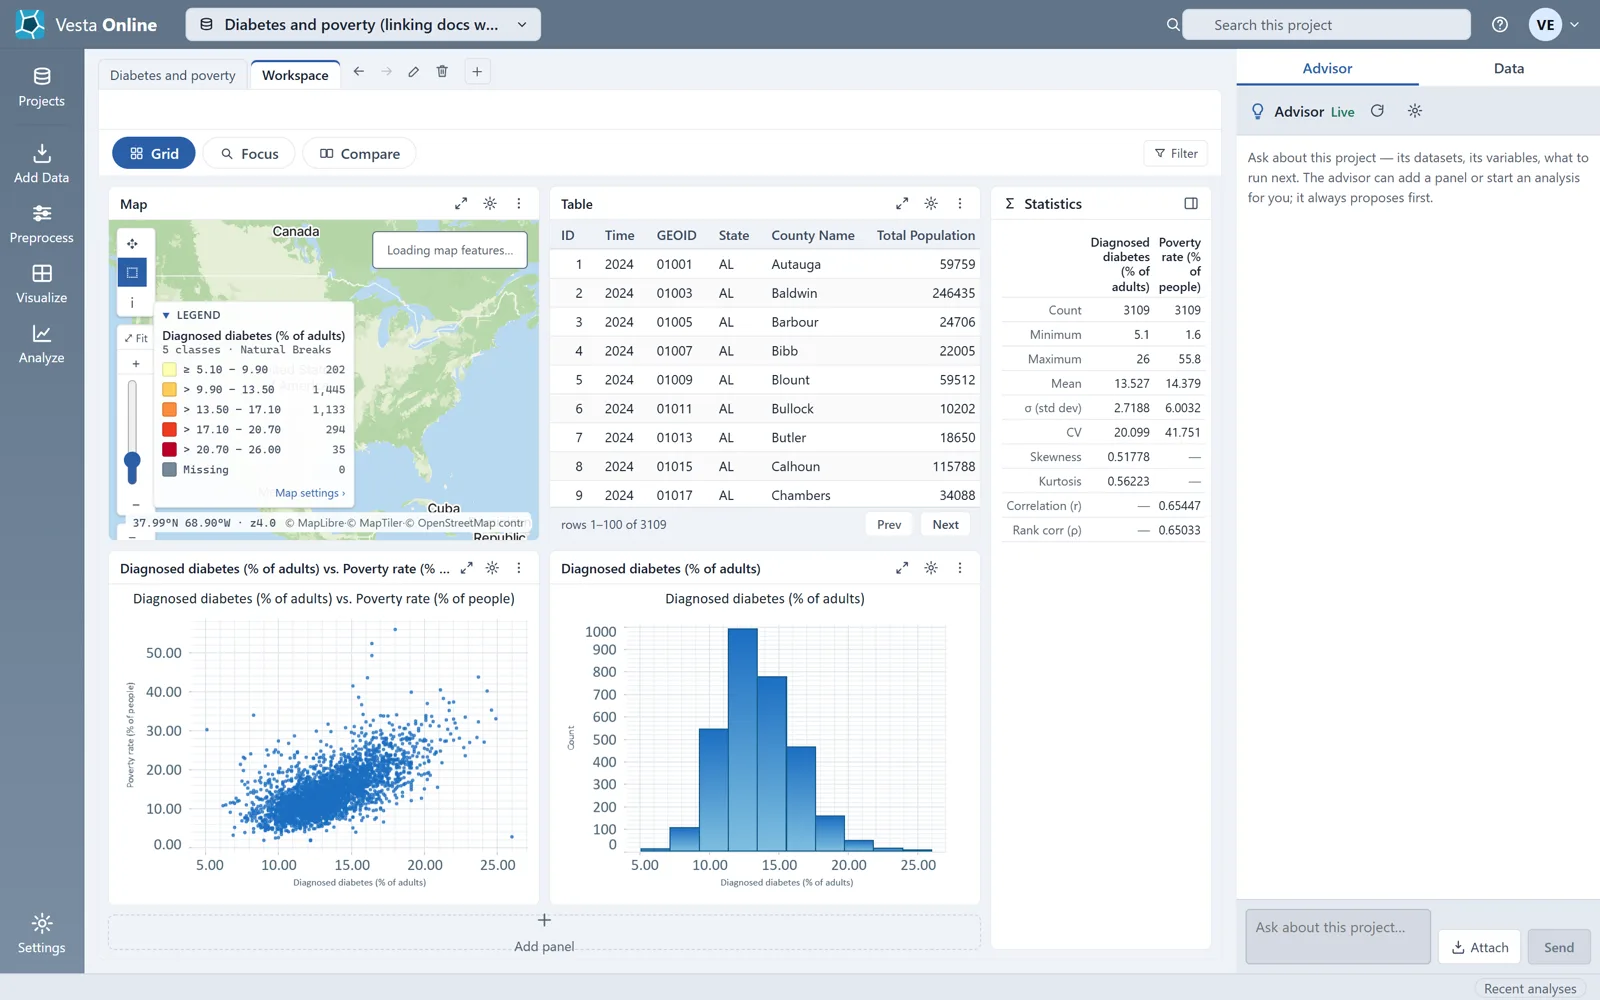
How to select in each panel
Section titled “How to select in each panel”- Map. Choose the Select tool first. Click a county to select it, or drag a box to select every county inside. A plain click or box replaces the selection; hold Shift to add to it. A click on empty map, away from any county, clears the selection. The map's tool rail holds only Pan, Select and Identify, so there is no lasso or polygon selection.
- Table. Click a row to select it, Ctrl-click to toggle one row, Shift-click to span from the row you last clicked, and Ctrl+Shift-click to add that span to the selection. The footer shows how many rows are selected.
- Scatterplot. Click a point to select it, or drag a box to select every point inside. A press that hits nothing clears the selection. Ctrl-drag is kept for zooming and leaves the selection alone.
- Histogram. Click a bar to select every county in that bin, or drag across bars to select every county in the bins the drag catches. The selected counties are drawn as a separate stack on top of each bar, as in the figures above.